Phantom Trading Robot Cost-Benefit Analysis: Calculate Real Costs and ROI
-

- March 07th, 2026
- 665 views

Get a free topical map and start building content authority today.
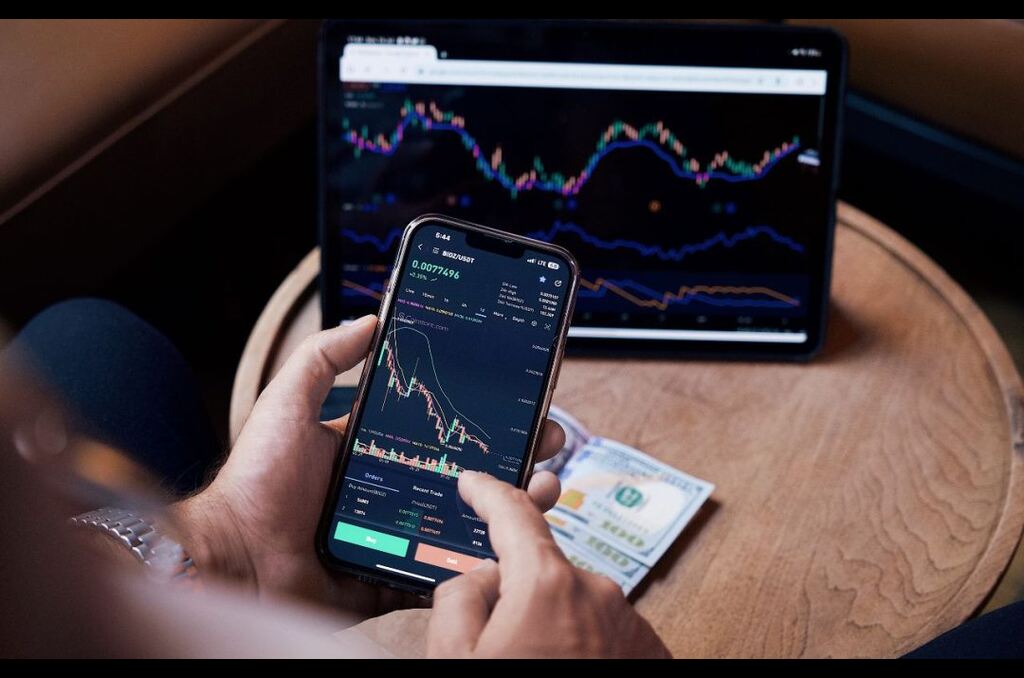
This article is a phantom trading robot cost-benefit analysis designed to show how to calculate true expenses, estimate likely returns, and weigh operational risks against expected gains. The goal is a practical, repeatable approach for traders evaluating an automated strategy or subscription trading bot.
Informational
- Net value depends on subscription & brokerage fees, slippage, latency, and strategy edge.
- Use the COST-BENCH framework to structure the analysis: Costs, Operational risk, Strategy fit, Testing, Brokerage, Execution, Net return, Compliance, Hidden risks.
- Run robust backtests, paper trade for several months, and track real trading fees and drawdowns before committing capital.
phantom trading robot cost-benefit analysis: how to judge value
What this analysis covers
The analysis breaks costs into direct and indirect categories, measures benefits as net performance after all expenses, and quantifies operational risks such as algorithmic trading risks and platform reliability. The first step is listing all inputs: subscription, automated trading costs, commissions, spread, slippage, VPS and API fees, capital usage, and tax impact.
Core framework: COST-BENCH
Introducing the COST-BENCH framework
COST-BENCH is a step-by-step checklist to evaluate a trading robot. Use it as an operational rubric when reviewing providers or building an in-house bot.
- Costs — subscription, brokerage, data, hosting
- Operational risk — uptime, vendor SLA, code quality
- Strategy fit — time frame, instruments, capacity limits
- Testing — backtest quality, out-of-sample, walk-forward
- Brokerage & fees — commissions, exchange fees, SEC/clearing costs
- Execution — latency, slippage, order routing
- Net return — gross returns minus all fees and taxes
- Compliance — regulatory checks and recordkeeping
- Hidden risks — data errors, curve-fitting, position sizing mistakes
Breaking down costs and benefits
Direct and indirect costs
Direct costs include subscription fees and commissions. Indirect costs — often underestimated — are slippage, increased margin usage, taxes on short-term gains, and opportunity cost from capital being illiquid during drawdowns. Automated trading costs typically include a VPS, API access, and higher turnover that increases commission drag.
Measuring benefits
Benefits are measured as realized alpha after costs and risk adjustments. Use metrics such as net return, maximum drawdown, Sharpe ratio, and a simple ROI calculation that subtracts all expense lines. For realistic expectations, subtract a stress penalty for degraded execution in live markets.
Real-world example
Scenario: $50,000 account evaluating a subscription bot
Example inputs:
- Subscription: $150/month
- Broker commissions & fees: $0.005 per share (average $25/month based on turnover)
- VPS/API: $20/month
- Estimated slippage & spread drag: 0.5% annually
- Projected gross return from backtests: 18% annually
- Gross return: $9,000 (18% of $50,000)
- Fees & subscription: $150*12 + $25*12 + $20*12 = $2,340
- Slippage drag (~0.5%): $250
- Estimated taxes (short-term): 30% on net gains (simplified) — tax on ($9,000 - $2,590) ≈ $1,623
- Net after fees & tax ≈ $4,787 → 9.6% net return
Practical tips to evaluate a trading robot
- Paper trade or run a small live pilot for 3–6 months to capture real execution effects before scaling.
- Track real automated trading costs per trade (commissions + average slippage) and update ROI calculations monthly.
- Validate backtests with out-of-sample and walk-forward testing to reduce overfitting risk.
- Confirm broker order routing and latency characteristics; some strategies are latency-sensitive and need colocated environments.
- Keep detailed logs and automated alerts for drawdowns and operational failures.
Trade-offs and common mistakes
Typical trade-offs
Higher-frequency approaches can increase potential return but also magnify automated trading costs and algorithmic trading risks like slippage. Cheaper subscriptions may lack support or reliable execution; paying more for robust infrastructure reduces operational risk but raises the break-even threshold.
Common mistakes
- Relying solely on in-sample backtests or cherry-picked time periods.
- Ignoring taxes and the impact of turnover on realized returns.
- Underestimating slippage and overestimating fill quality from paper trading.
- Failing to plan for stop-losses, connectivity issues, or vendor abandonment.
Regulation and best practices
Automated strategies and advisory services may fall under regulatory guidance; confirm whether the provider follows advisor or broker rules, especially for pooled client assets. For general guidance on automated advisory services and investor protections, review the SEC investor bulletin on robo-advisers for best-practice expectations: SEC investor bulletin on robo-advisers.
Core cluster questions
- How to calculate all-in trading bot costs for a small account?
- What metrics prove a trading robot's live edge after fees?
- How does slippage impact high-frequency algorithmic strategies?
- When to scale a profitable automated strategy safely?
- What operational checks reduce vendor and infrastructure risk?
Final assessment checklist
Use this short checklist before committing funds:
- Run 3–6 months of live paper trading and record realized costs.
- Confirm strategy capacity and expected drawdown tolerances.
- Verify vendor uptime SLA and support response times.
- Calculate net return after all fees and taxes; require a minimum risk-adjusted margin above your alternative investments.
FAQ
What is a phantom trading robot cost-benefit analysis?
A phantom trading robot cost-benefit analysis is a structured evaluation that lists all costs (subscription, commissions, hosting, slippage, taxes) and compares them to expected gross returns after accounting for operational and execution risk to produce a realistic net return estimate.
How much do automated trading costs typically add up to?
Costs vary widely by strategy and turnover. For mid-frequency retail bots, expect subscription plus trading fees and hosting to range from a few hundred to several thousand dollars per year; high-frequency strategies can see much larger percentage drag from slippage and exchange fees.
Can backtest results be trusted to predict live performance?
Backtests offer signals but are prone to overfitting. Trust is increased by out-of-sample tests, walk-forward validation, and live paper trading that captures real fills and slippage.
What are common signs a trading robot is not worth the cost?
Red flags include poor out-of-sample performance, excessive sensitivity to execution quality, high subscription fees relative to achievable net returns, and lack of transparency on order execution and fill rates.
How should results be monitored after deployment?
Track realized net returns, per-trade costs, win rate, average profit/loss, and maximum drawdown. Automate alerts for performance drift and unexpected downtime. Re-evaluate the COST-BENCH checklist quarterly.