Grafana Open Source: The Ultimate Guide to Getting Started

Strong 8k brings an ultra-HD IPTV experience to your living room and your pocket.
In the world of data visualization and monitoring, Grafana Open Source stands out as a leading tool for creating interactive and customizable dashboards. Whether you're managing a small project or handling large-scale enterprise data, Grafana offers powerful features to help you visualize and analyze your data effectively. This guide will walk you through the essentials of getting started with Grafana Open Source, from installation to advanced features.
What is Grafana Open Source?
Grafana is an open-source platform designed for visualizing and analyzing time-series data. Initially developed for monitoring metrics, it has evolved into a versatile tool that supports various data sources and integrates seamlessly with popular databases and services. Grafana Open Source allows users to create dashboards that provide real-time insights into their systems, applications, and infrastructure.
Key Features of Grafana Open Source
1. Customizable Dashboards
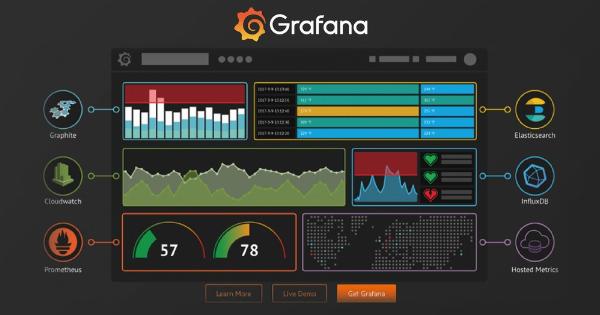
Grafana enables you to create highly customizable dashboards that can display data from multiple sources. You can arrange and resize panels, apply different visualization types (graphs, tables, heatmaps), and configure alerting rules. This flexibility allows users to tailor dashboards to their specific needs and preferences.
2. Rich Data Source Integration
Grafana supports integration with a wide range of data sources, including:
-
Prometheus: For monitoring and alerting.
- Elasticsearch: For log and event data analysis.
- InfluxDB: For time-series data.
- MySQL/PostgreSQL: For relational database queries.
- Cloud Services: Like AWS CloudWatch and Google Cloud Monitoring.
3. Advanced Visualization Options
Grafana provides various visualization options to help users interpret their data effectively. Some popular visualizations include:
-
Time Series Graphs: For displaying data trends over time.
- Heatmaps: For visualizing the density of data points.
- Bar and Pie Charts: For categorical data representation.
- Tables: For detailed data inspection.
4. Alerting and Notifications
Grafana's alerting system allows you to set up thresholds and receive notifications based on specific conditions. Alerts can be configured to send notifications through various channels, such as email, Slack, or custom webhooks. This feature is crucial for proactively monitoring system health and performance.
5. User Management and Permissions
Grafana supports user management, allowing administrators to set up different roles and permissions. This feature ensures that sensitive data and dashboard configurations are accessible only to authorized users.
Getting Started with Grafana Open Source
1. Installation
Grafana can be installed on various operating systems, including Windows, macOS, and Linux. Here's a basic guide to installing Grafana Open Source:
-
On Linux: You can use the package manager (e.g., apt for Debian-based distributions or yum for Red Hat-based distributions) to install Grafana. Visit the Grafana website for detailed instructions and repositories.
-
On Windows and macOS: Download the installer from the Grafana website and follow the installation prompts.
-
Docker: Grafana can also be run as a Docker container, which simplifies deployment and management.
2. Configuration
After installation, Grafana can be accessed through a web browser at http://localhost:3000. The default login credentials are admin for both username and password. Upon first login, you'll be prompted to change the default password.
3. Adding Data Sources
To start visualizing data, you'll need to add data sources:
- Go to the Grafana web interface and click on the gear icon (⚙️) in the sidebar.
- Select Data Sources and then Add data source.
- Choose your data source type and configure the necessary connection details (e.g., URL, credentials).
4. Creating Dashboards
To create a dashboard:
- Click on the "+" icon in the sidebar and select Dashboard.
- Add new panels by clicking on Add new panel.
- Configure the panel settings, including the data source, visualization type, and query parameters.
- Save the dashboard by clicking on the disk icon or selecting Save from the dashboard menu.
5. Setting Up Alerts
To configure alerts:
- Open the panel you want to set up alerts for.
- Click on the Alert tab in the panel editor.
- Define the alert conditions and configure notification channels.
- Save your changes and activate the alert.
Advanced Tips for Grafana Open Source
1. Custom Plugins
Grafana's open-source nature allows for extensive customization through plugins. You can find a wide range of community-developed plugins for additional data sources, visualizations, and panels. Browse the Grafana Plugin Directory to explore available options.
2. Performance Optimization
For large-scale deployments, optimizing Grafana performance is crucial. Consider tuning the following aspects:
-
Data Source Queries: Optimize your queries to reduce the load on your data sources.
- Caching: Utilize caching mechanisms to improve dashboard load times.
- Scaling: Deploy Grafana in a clustered environment to handle increased traffic and data volume.
3. Security Best Practices
Ensure your Grafana instance is secure by following these best practices:
-
Use HTTPS: Configure Grafana to use HTTPS for secure communication.
- Restrict Access: Limit access to Grafana using firewalls and network controls.
- Regular Updates: Keep Grafana updated to the latest version to benefit from security patches and new features.
Conclusion
Grafana Open Source is a powerful tool for data visualization and monitoring, offering a range of features to help users gain insights from their data. By following this guide, you'll be equipped to set up Grafana, connect data sources, create dashboards, and configure alerts. As you become more familiar with Grafana, you'll be able to leverage its advanced features and customization options to enhance your data analysis capabilities.
For those looking to dive deeper, exploring the Grafana documentation and community forums will provide additional insights and support. With Grafana Open Source, the possibilities for visualizing and understanding your data are virtually limitless.
Note: IndiBlogHub features both user-submitted and editorial content. We do not verify third-party contributions. Read our Disclaimer and Privacy Policyfor details.


