Press Releases That Rank – Boost Authority & Brand Trust Fast!
Written by Adam smith » Updated on: June 17th, 2025
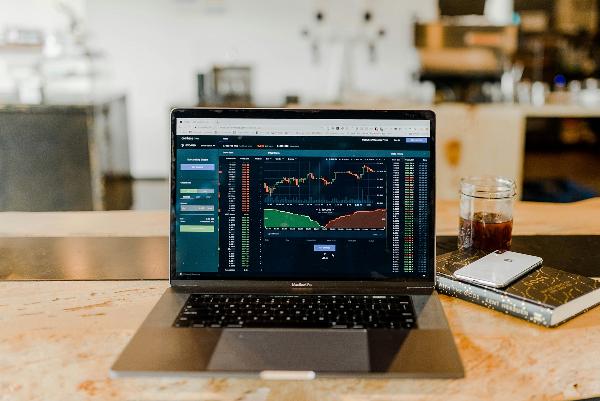
Understanding how to read crypto trading charts is essential for anyone looking to succeed in cryptocurrency trading. These charts provide valuable insights into market trends, price movements, and trading volumes, helping traders make informed decisions. In this guide, we will walk you through the key components of Finance Legend App and how to analyze them effectively to enhance your trading strategies.
1.1 Line Charts
Line charts are one of the simplest types of charts, showing a continuous line that represents the closing prices of a cryptocurrency over time. They are useful for getting a quick overview of the general direction of a price trend. However, they lack detailed information about price fluctuations within a given period.
Key Features:
Simplicity: Easy to understand and interpret.
Focus on Closing Prices: Provides a clear view of the overall trend.
Limited Detail: Does not show price highs, lows, or trading volumes.
1.2 Bar Charts
Bar charts provide more detail than line charts by showing the open, high, low, and close (OHLC) prices for a specific time period. Each bar represents one time interval, and the length of the bar reflects the range between the high and low prices.
Key Features:
Detailed Information: Shows open, high, low, and close prices.
Trend Analysis: Helps identify trends and price ranges.
Visual Clarity: Bars can be color-coded to indicate bullish or bearish movements.
1.3 Candlestick Charts
Candlestick charts are among the most popular chart types in crypto trading. They provide a detailed view of price movements by representing open, high, low, and close prices in the form of candlesticks. Each candlestick typically covers a specific time interval, such as 1 hour or 1 day.
Key Features:
Detailed Candlesticks: Each candlestick shows open, high, low, and close prices.
Visual Patterns: Candlestick patterns can indicate potential market reversals or continuations.
Color Coding: Candlesticks are often color-coded to show bullish (up) or bearish (down) movements.
2.1 Price Axes
The price axis, usually located on the right side of the chart, shows the current price levels of the cryptocurrency. It provides a reference for understanding the price changes and trends over time.
Understanding the Price Axis:
Price Levels: Reflects the scale of price changes.
Volatility Indicators: Helps identify periods of high or low volatility.
Trend Reference: Provides context for price trends and patterns.
2.2 Time Axes
The time axis, located at the bottom of the chart, represents the time intervals for each data point or candlestick. It could range from seconds to months, depending on the chart's timeframe.
Understanding the Time Axis:
Time Intervals: Shows the duration for which the price data is aggregated.
Trend Analysis: Helps in analyzing short-term vs. long-term trends.
Historical Context: Provides context for price movements and patterns over different timeframes.
2.3 Volume Bars
Volume bars are displayed at the bottom of the chart and represent the total trading volume for each time period. They provide insights into the strength of price movements and market activity.
Understanding Volume Bars:
Volume Levels: Shows the amount of cryptocurrency traded.
Confirmation of Trends: High volume can confirm the strength of price trends or reversals.
Market Sentiment: Provides insights into trader activity and market interest.
3.1 Bullish Patterns
Bullish candlestick patterns indicate potential upward price movements. Common patterns include:
Hammer: A candlestick with a small body and a long lower shadow, suggesting a potential reversal from a downtrend.
Engulfing: A pattern where a small bearish candle is followed by a larger bullish candle, indicating a possible trend reversal.
Key Indicators:
Hammer Pattern: Suggests a potential price reversal.
Engulfing Pattern: Indicates a strong shift in market sentiment.
3.2 Bearish Patterns
Bearish candlestick patterns signal potential downward price movements. Common patterns include:
Shooting Star: A candlestick with a small body and a long upper shadow, suggesting a potential reversal from an uptrend.
Dark Cloud Cover: A pattern where a bullish candle is followed by a larger bearish candle, indicating a possible trend reversal.
Key Indicators:
Shooting Star: Indicates a potential price drop.
Dark Cloud Cover: Signals a shift from bullish to bearish sentiment.
3.3 Continuation Patterns
Continuation patterns suggest that the current trend is likely to continue. Common patterns include:
Flags and Pennants: Short-term consolidation patterns that typically occur after a strong price movement, indicating that the previous trend is likely to continue.
Triangles: Patterns where the price converges between two trendlines, suggesting a potential breakout in the direction of the existing trend.
Key Indicators:
Flags and Pennants: Indicate trend continuation.
Triangles: Signal potential breakout directions.
4.1 Moving Averages
Moving averages smooth out price data to identify trends and potential support or resistance levels. Common types include:
Simple Moving Average (SMA): Calculates the average price over a specific period.
Exponential Moving Average (EMA): Gives more weight to recent prices, providing a more responsive indicator.
Key Indicators:
SMA: Provides a basic trend direction.
EMA: Reacts more quickly to price changes.
4.2 Relative Strength Index (RSI)
The RSI is a momentum oscillator that measures the speed and change of price movements. It ranges from 0 to 100 and helps identify overbought or oversold conditions.
Key Indicators:
RSI Levels: An RSI above 70 may indicate overbought conditions, while an RSI below 30 may indicate oversold conditions.
Divergence: RSI divergence from price trends can signal potential reversals.
4.3 Bollinger Bands
Bollinger Bands consist of a middle band (SMA) and two outer bands that represent standard deviations. They help identify volatility and potential price reversals.
Key Indicators:
Band Width: Wider bands indicate higher volatility, while narrower bands indicate lower volatility.
Price Touches: Price touching the outer bands can signal potential reversals or breakouts.
5.1 Trend Following
Trend following strategies involve identifying and trading in the direction of the prevailing trend. Use moving averages, trendlines, and trend-following indicators to guide your trades.
Key Indicators:
Moving Averages: Help identify and confirm trends.
Trendlines: Provide visual support and resistance levels.
5.2 Counter-Trend Trading
Counter-trend trading involves trading against the current trend, typically at perceived overbought or oversold conditions. Use RSI, candlestick patterns, and reversal indicators to identify potential entry points.
Key Indicators:
RSI: Helps identify overbought or oversold conditions.
Candlestick Patterns: Provide signals for potential reversals.
5.3 Risk Management
Effective risk management is essential for successful trading. Set stop-loss orders, use position sizing strategies, and diversify your trades to manage risk and protect your capital.
Key Indicators:
Stop-Loss Orders: Limit potential losses on individual trades.
Position Sizing: Adjust trade size based on risk tolerance and account size.
Reading crypto trading charts like a pro involves understanding different chart types, analyzing key components, and interpreting candlestick patterns and technical indicators. By mastering these skills, you can make more informed trading decisions, develop effective strategies, and navigate the complexities of the cryptocurrency market with confidence. Remember that practice and continuous learning are key to improving your chart-reading abilities and enhancing your overall trading performance.
Note: IndiBlogHub features both user-submitted and editorial content. We do not verify third-party contributions. Read our Disclaimer and Privacy Policyfor details.
Sponsored Ad Partners


![]()


Copyright © 2019-2025 IndiBlogHub.com. All rights reserved. Hosted on DigitalOcean for fast, reliable performance.