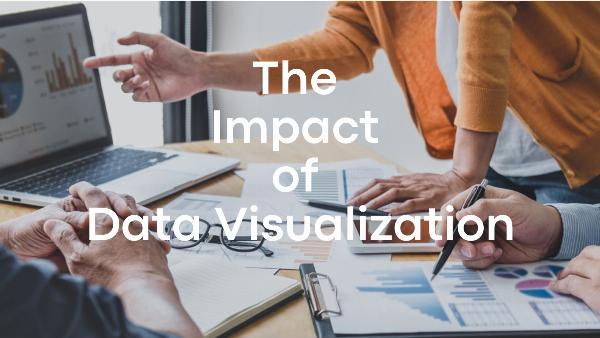
The Impact of Data Visualization

Strong 8k brings an ultra-HD IPTV experience to your living room and your pocket.
In today's data-driven world, information is collected at an unprecedented rate. However, raw data, no matter how vast or insightful, is meaningless without the ability to interpret and understand it. Data visualization plays a crucial role in translating complex data into understandable, visual formats, allowing users to detect patterns, trends, and outliers that might be missed in text-based data.
What is Data Visualization?
Data visualization is the graphical representation of data through visual elements like charts, graphs, maps, and diagrams. The primary goal is to make data more accessible, easier to understand, and to convey information effectively. By using visual cues like shapes, colors, and sizes, data visualization allows users to quickly grasp complex ideas without needing to go through volumes of raw numbers.
Key Components of Data Visualization
- Charts and Graphs: Bar charts, line graphs, pie charts, etc., to represent data points.
- Maps: Geospatial data shown through maps to highlight regional variations.
- Dashboards: Interactive, real-time data displays that show different metrics at a glance.
-
Infographics: Simplified, aesthetically engaging representations of data.
Why is Data Visualization Important?
1. Simplifying Complex Data
One of the primary reasons for using data visualization is that it simplifies large and complex data sets. By converting data into a graphical form, it becomes easier to digest. Consider trying to understand a large spreadsheet of numbers versus viewing the same data in a bar graph. A well-designed graph can instantly communicate what the numbers mean and help users focus on the key points.
Example:
If a business collects data on customer preferences, converting that data into a pie chart showing product popularity can offer quick insights into consumer behavior patterns.
2. Improving Decision-Making
Informed decision-making relies on the ability to process and understand data efficiently. Visual data helps decision-makers identify trends and patterns more rapidly. By transforming raw data into charts and graphs, stakeholders can make well-informed decisions based on visualized insights, such as market trends, financial performance, or customer behavior.
Example:
A company's sales team could use a line graph to track sales over time, helping them make strategic decisions like when to ramp up marketing efforts based on identified patterns in sales performance.
3. Enhancing Data Accuracy and Consistency
Visualizing data enables clearer communication and ensures that everyone involved interprets the data the same way. Visual formats reduce the risk of misunderstanding the data compared to reading through long reports. Well-organized dashboards can provide real-time, accurate data representations that enable faster and more consistent conclusions.
Example:
In a business meeting, presenting data through visualizations like graphs or dashboards can ensure that everyone is on the same page regarding the data’s meaning.
4. Identifying Trends and Outliers
Visual tools make it easy to spot trends, correlations, and outliers that could be missed in textual or numeric data sets. This ability to highlight both positive and negative patterns allows businesses or individuals to act on the findings more efficiently.
Example:
In financial data analysis, a sudden spike in expenditure is easier to detect on a graph than in a detailed ledger of numbers. Early detection of outliers can prevent potential risks or capitalize on opportunities.
5. Engaging and Persuasive Communication
Data visualization enhances engagement and makes it easier to present findings persuasively. A visually compelling representation of data, especially one that uses storytelling techniques, can evoke a stronger emotional response, aiding in persuasion and helping convey key messages more effectively.
Example:
During a marketing campaign analysis, a bar graph showing increased customer engagement post-campaign is far more persuasive than simply stating that engagement increased by 20%.
6. Facilitating Pattern Recognition
Human brains are wired to recognize patterns, and data visualization takes advantage of this cognitive strength. Graphical representations, like heat maps or scatter plots, allow users to see trends and correlations in data, often helping them predict future outcomes or identify problem areas.
Example:
In healthcare analytics, a heat map might be used to show the concentration of disease outbreaks in different regions, helping public health officials to allocate resources more efficiently.
Common Types of Data Visualizations
1. Bar Charts
Bar charts are among the most common data visualization tools. They represent data using rectangular bars whose lengths correspond to the values they represent. They are ideal for comparing different categories or tracking changes over time.
2. Line Graphs
Line graphs use points connected by lines to show how values change over time or in response to certain variables. They are excellent for visualizing trends over time.
3. Pie Charts
Pie charts break down data into proportional slices, each representing a portion of the total. They are best used for showing percentages or parts of a whole.
4. Heat Maps
Heat maps use color intensity to represent data values in a matrix format, helping to identify high and low areas in data.
5. Scatter Plots
Scatter plots display data points on two axes to reveal relationships between variables. They are perfect for spotting correlations and outliers.
Best Practices for Effective Data Visualization
1. Know Your Audience
Before creating a data visualization, it is essential to understand who will be using it. Different audiences require different levels of detail. For example, a financial team might need highly detailed graphs, while a marketing team may prefer high-level overviews.
2. Choose the Right Visualization Tool
Choosing the right type of visualization is critical. Not all types of visualizations work for every data set. For example, a pie chart might not be ideal for data that requires showing trends over time; a line graph would be more appropriate.
3. Simplify and Focus on the Message
Keep the visualization simple and focused. Too much data on a single graph or dashboard can be overwhelming. Highlight the key insights that are relevant to the decision-making process. Avoid clutter and unnecessary design elements.
4. Use Color Wisely
Color is a powerful tool in data visualization but can be misleading if overused or misused. Stick to a clear, logical color scheme that enhances the readability of the data without causing confusion.
5. Leverage Interactivity
Interactive dashboards allow users to explore the data in greater depth. By clicking on certain elements, users can drill down into the data or view related metrics, creating a more engaging experience.
Tools for Creating Data Visualizations
There are numerous tools available for creating data visualizations, ranging from simple to advanced. Here are a few popular options:
1. Tableau
Tableau is one of the most widely used data visualization tools. It offers drag-and-drop functionality and interactive dashboards.
2. Microsoft Power BI
Microsoft Power BI provides easy-to-use tools for creating interactive dashboards and reports, making it ideal for businesses.
3. Google Data Studio
Google Data Studio is a free, web-based tool that integrates well with other Google products like Google Analytics and Google Sheets.
4. D3.js
For those with programming skills, D3.js is a powerful JavaScript library for creating custom, highly interactive visualizations.
Conclusion
Data visualization is an indispensable tool for businesses, analysts, and decision-makers in today's data-rich world. It not only simplifies the interpretation of complex data but also enhances decision-making, improves communication, and reveals insights that may otherwise remain hidden. Whether you're tracking market trends or analyzing customer behavior, visualizing data ensures that you can act on it effectively and efficiently.
For those looking to master these skills, there are many training programs available. You can opt for a data analytics training course in Noida, Delhi, Meerut, Chandigarh, Pune, and other cities located in India to gain hands-on experience and better understand how data visualization can impact business strategy.
Note: IndiBlogHub features both user-submitted and editorial content. We do not verify third-party contributions. Read our Disclaimer and Privacy Policyfor details.


