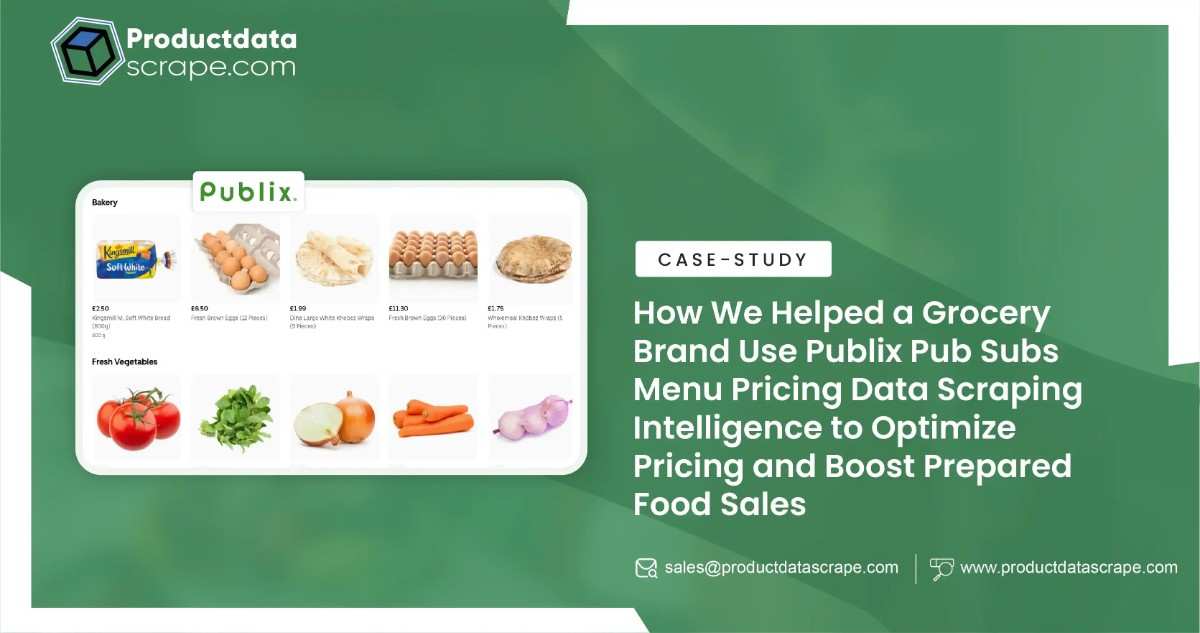
Retail Analytics Cube: How to Build and Use a Retail Data Cube for Inventory and Insights
-

- March 01st, 2026
- 258 views

Get a free topical map and start building content authority today.
The retail analytics cube is a multidimensional model used to analyze sales, inventory, promotions, and customer behavior across stores and channels. This guide explains how a retail analytics cube works, what to build first, and how to use it to improve inventory accuracy, demand forecasting, and omnichannel visibility.
Detected intent: Informational
Quick take: A retail analytics cube transforms transactional and master data into OLAP-style dimensions (time, SKU, store, channel) and measures (units, revenue, margin) that make cross-cutting retail analysis fast and reusable.
Primary actions: assemble clean POS and inventory feeds, design dimensions, build aggregated measures, validate with business KPIs, and operationalize in dashboards or BI tools.
What is a retail analytics cube and why it matters
A retail analytics cube is a structured, often aggregated, data model that enables fast queries across combinations of dimensions such as product, location, time, and promotion. Because it precomputes common aggregates it speeds up reporting and advanced analysis (promotion lift, store clustering, SKU lifecycle) compared with ad-hoc queries against raw transactional systems.
Core components: dimensions, measures, and data sources
Key dimensions
- Product (SKU hierarchy, attributes, category)
- Location (store, DC, region)
- Time (day, week, fiscal period)
- Customer or segment (loyalty tier, acquisition channel)
- Promotion and price (promotion id, markdown flags)
Primary measures
Units sold, revenue, margin, on-hand inventory, stockouts, returns, and days of supply are common cube measures. These feed KPIs such as sell-through, gross margin return on inventory (GMROI), and on-shelf availability.
How to build a retail analytics cube: a practical CUBE checklist
Use the CUBE checklist to structure the implementation and testing process.
- Clean — Validate and clean POS, inventory, and master data (correct SKUs, timestamps, store mappings).
- Unify — Standardize keys and attributes across systems (SKU master, location codes, time calendar).
- Build — Define dimensions and measures, implement aggregations and ETL/ELT.
- Evaluate — Compare cube outputs to source-of-truth KPIs and run reconciliation checks.
Retail data modeling and omnichannel inventory cube: practical steps
For stores and e-commerce, an omnichannel inventory cube extends the same model to include digital channels, fulfillment types (ship-from-store, BOPIS), and available-to-promise (ATP) calculations. Good retail data modeling clarifies which inventory counts (physical, available, reserved) are used for each measure.
Real-world example: small chain improves promotions and stock
A regional apparel chain built a retail analytics cube that joined POS, inventory, and marketing campaign data. After implementing weekly aggregated measures and SKU-category dimensions, the merchandising team reduced promotional overlap, lowered excess markdowns by 8%, and improved in-season replenishment cadence. This scenario highlights how a focused cube—rather than a monolithic data warehouse redesign—can deliver measurable ROI.
Practical tips to get value fast
- Start with a limited scope: one region, top-selling categories, and weekly aggregates before expanding granularity.
- Automate reconciliation jobs that compare cube totals with source systems to catch ETL drift early.
- Use a standard time calendar (fiscal weeks) and keep versioned SKU masters for historical accuracy.
- Prioritize measures that map directly to decisions: inventory turns, promotion lift, stockouts by hour/day.
Common mistakes and trade-offs when designing a retail analytics cube
Trade-offs
- Granularity vs. performance: Daily or hourly grain increases utility but also storage and rebuild time.
- Pre-aggregation vs. flexibility: Precomputed aggregates speed dashboards but reduce ad-hoc query flexibility.
- Single source of truth vs. practical blends: Strictly enforcing one master may delay delivery; pragmatic sync rules can accelerate results.
Common mistakes
- Not versioning SKU attributes (causes incorrect historical reporting when categories change).
- Mixing physical and available inventory without clear measure definitions.
- Skipping reconciliation tests that detect ETL or mapping errors early.
Governance, validation, and industry standards
Establish data ownership for dimensions and regular validation checks. Industry groups such as the National Retail Federation publish retail benchmarks and best practices that can inform KPIs and definitions: NRF — National Retail Federation. Aligning terminology across merchandising, supply chain, and finance reduces rework and confusion.
Core cluster questions (for related articles and internal linking)
- How does a retail analytics cube improve inventory forecasting?
- What dimensions should be included in a SKU-level retail cube?
- When to use pre-aggregated cubes versus live query tables?
- How to reconcile cube measures with point-of-sale and ERP systems?
- What architectures support real-time or near-real-time retail cubes?
Implementation checklist (quick)
- Define scope and KPIs
- Prepare and clean master data
- Design dimensions and aggregation strategy
- Build ETL/ELT and aggregation jobs
- Validate outputs and operationalize dashboards
When to expand or modernize the cube
Expand to finer time grain, more SKUs, or customer-level analysis when reconciliation is stable and business users request new slices. Consider moving to a hybrid approach (pre-aggregated cubes plus ad-hoc OLAP/SQL layers) for balance between speed and flexibility.
What is a retail analytics cube?
Answer: A retail analytics cube is a multidimensional data model used to accelerate analysis across product, time, location, and promotional dimensions by precomputing and storing commonly used aggregates.
How does retail data modeling affect reporting accuracy?
Answer: Clear modeling of SKU hierarchies, time calendars, and inventory definitions prevents mismatched totals, supports historical comparisons, and ensures that KPIs like sell-through and GMROI are reliable.
Which metrics should an omnichannel inventory cube track?
Answer: Track physical on-hand, available inventory, reserved units (orders), stockouts, replenishment lead times, and fulfillment types (ship-from-store, BOPIS) to support omnichannel decisions.
What are common ETL checks for cube validation?
Answer: Reconcile cube totals with source systems, validate SKU mappings, check time-zone and calendar alignment, and monitor data latency and load failures.
How often should a retail analytics cube refresh?
Answer: Refresh cadence depends on use: nightly for daily decisions, hourly for intraday replenishment, and near-real-time only when operational systems and costs justify the complexity.