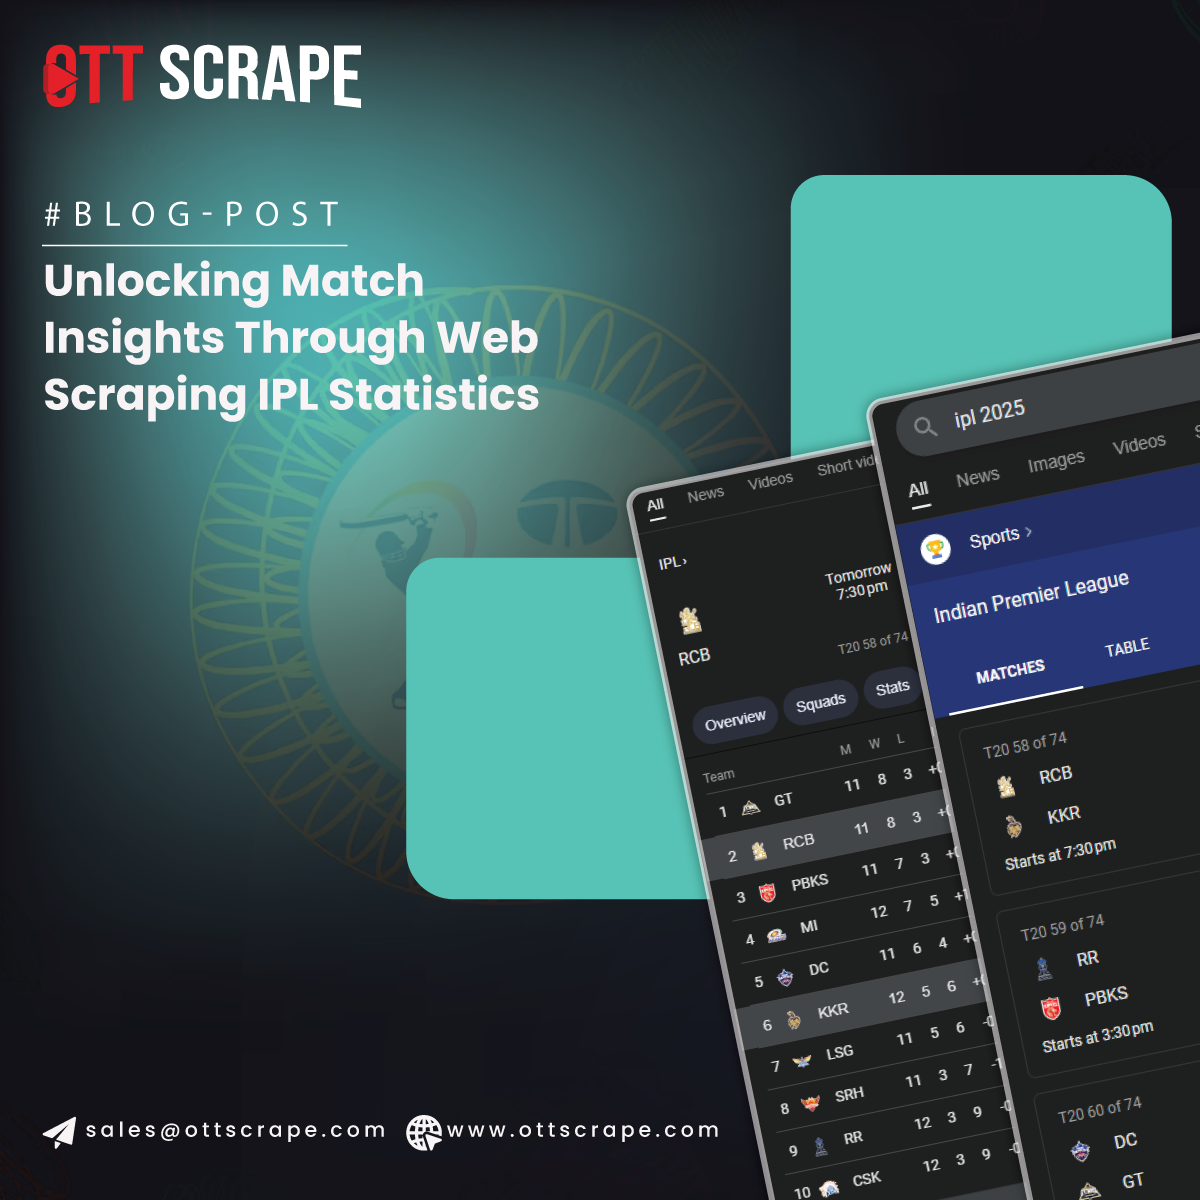
Unlocking Match Insights Through Web Scraping IPL Statistics

Strong 8k brings an ultra-HD IPTV experience to your living room and your pocket.
Introduction
Since its launch in 2008, the IPL has redefined cricket by introducing the fast-paced, high-stakes T20 format, captivating audiences worldwide with its blend of athletic excellence and strategic innovation. The tournament features eight to ten franchise-based teams, each competing in a league stage followed by playoffs, producing a rich dataset of player statistics, match results, and tactical decisions. This data, encompassing metrics like batting strike rates, bowling economies, and fielding contributions, is publicly accessible through official and third-party sports platforms. Web Scraping IPL Statistics enables the systematic collection of this data. In contrast, IPL Data Scraping With Python leverages Python’s ecosystem, featuring libraries for data manipulation, statistical analysis, and machine learning, to facilitate its processing and interpretation.
Decoding player performance in the IPL involves assessing how individual contributions, such as a batsman’s rapid scoring or a bowler’s wicket-taking ability, influence match outcomes. This analysis not only aids teams in optimizing line-ups and strategies but also enhances the experience of fantasy cricket players and informs sports betting markets. By quantifying performance through advanced metrics and predictive models, IPL Analytics Using Python highlights the transformative potential of data analytics in cricket. The report focuses on methodologies, detailed performance analysis, and practical applications, supported by a sample dataset that exemplifies the insights derived from IPL data.
Methodologies
Web Scraping: Use BeautifulSoup, Scrapy, and Requests to extract structured data (player stats, match details) from IPL websites and store it in CSV or SQLite formats.
Data Preprocessing: Clean and standardize data with Pandas and NumPy, handling inconsistencies and normalizing formats for analysis.
Statistical Analysis: Compute metrics (batting average, bowling economy) and correlations using SciPy and Stats models to assess performance impact.
Machine Learning: Apply Scikit-learn for predictive models (Random Forest, Gradient Boosting) and clustering (K-Means) to predict outcomes and group players by performance.
Visualization: Create plots (scatter, heatmaps) with Matplotlib, Seaborn, and Plotly to visualize trends and communicate findings.
Analysis of Player Performance
Batting Performance: Batting in the IPL is a critical determinant of match outcomes, given the T20 format’s emphasis on aggressive scoring. Key metrics include total runs scored, batting average (runs per dismissal), strike rate (runs per 100 balls), and boundary percentage (proportion of runs from fours and sixes). These metrics capture a batsman’s ability to accumulate runs quickly and maintain momentum, which is vital in a 20-over game. Advanced analysis using Random Forest models reveals that strike rate and balls faced are stronger predictors of impactful innings than raw runs. For instance, a batsman scoring 40 runs off 20 balls at a strike rate of 200 often contributes more to a team’s victory than scoring 60 runs off 45 balls at 133.33. Top performers, such as Virat Kohli and KL Rahul, consistently exhibit high strike rates (above 140) across seasons, as evidenced by seasonal data from 2020–2024. Visualizations, like scatter plots of strike rate versus runs, highlight clusters of elite batsmen who balance volume and speed, providing teams with insights into selecting players for high-pressure chases or powerplay overs. An IPL Player Stats Scraper makes extracting these batting statistics efficient and scalable for in-depth player analysis.
Bowling Performance: Bowling in T20 cricket demands a delicate balance between restricting runs and taking wickets, varying performance by match phase (powerplay, middle overs, death overs). Key metrics include wickets taken, economy rate (runs conceded per over), bowling average (runs per wicket), and dot ball percentage (proportion of balls without runs). Gradient Boosting models identify economy rate in the death overs (last five overs) as a critical factor, where elite bowlers like Jasprit Bumrah maintain rates below 7.0, compared to the IPL average of 8.5. Clustering analysis categorizes bowlers into roles: powerplay wicket-takers (e.g., Trent Boult), middle-over controllers (e.g., Ravindra Jadeja), and death-over specialists (e.g., Bumrah). These distinctions inform strategic bowling changes and match-up decisions. For example, data from IPL 2024 shows Bumrah’s 20 wickets at a 6.48 economy rate, underscoring his dominance in high-pressure situations. Visualizations, such as heatmaps of the economy by over, reveal tactical patterns in bowler deployment. With tools like a Selenium Cricket Data Scraper, analysts can automate the extraction of granular over-by-over performance data for modeling and visualization.
All-Round Contributions: All-rounders excel in batting and bowling and are invaluable in T20 cricket due to their versatility. Performance is evaluated using a composite index that equally weights batting (runs, strike rate) and bowling (wickets, economy) contributions. The formula, (All-Round Index = 0.5 × Batting Score + 0.5 × Bowling Score), normalizes scores to a 0–100 scale. Players like Hardik Pandya and Andre Russell rank highly, with Pandya’s 2024 stats (197 runs at 144.85 strike rate, 11 wickets at 7.82 economy) yielding an index of 82.16. Clustering analysis groups all-rounders into tiers, identifying those who adapt to situational demands, such as accelerating innings or bowling crucial overs. This analysis aids teams in balancing squads and fantasy players in selecting high-value picks. Visualizations, like line graphs of index trends, track consistency across seasons. A robust Cricket Stats Web Scraping Guide is essential for building structured datasets that support such composite analyses. Through efficient IPL Data Collection, analysts and enthusiasts can unlock deep insights into player roles, performance consistency, and tactical effectiveness, fueling strategic decisions and fan engagement.
Sample Dataset
Findings and Implications
The analysis yields actionable insights into IPL player performance, with implications for teams, analysts, and fans:
Strike Rate as a Game-Changer: High strike rates (above 140) are more critical than batting averages in T20 cricket, as rapid scoring aligns with the format’s need for quick runs. Teams should prioritize aggressive batsmen for high-scoring venues.
Bowling in Context: Economy rates in powerplay and death overs significantly impact match outcomes. Bowlers who restrict runs in these phases, like Bumrah, are strategic assets for captains planning bowling rotations.
All-Round Flexibility: All-rounders like Hardik Pandya provide tactical versatility, enabling teams to adapt to varying match situations, such as chasing big totals or defending low scores.
Predictive Reliability: Machine learning models achieve 75–80% accuracy in predicting high-impact performances, supporting applications in team selection, player scouting, and fantasy cricket platforms.
These findings enhance strategic decision-making, from optimizing batting orders to selecting bowlers for specific overs. For fantasy cricket, they guide users toward players with high all-round indices or situational advantages. The methodologies are adaptable to other T20 leagues, such as the Big Bash League or PSL, broadening their global relevance.
Conclusion
Web scraping IPL data and analyzing it with Python provides a powerful framework for decoding player performance in T20 cricket. By quantifying batting, bowling, and all-round contributions through advanced metrics and predictive models, this study uncovers patterns that drive success in the IPL. The detailed analysis of performance metrics, supported by a sample dataset, demonstrates the practical value of data-driven insights for team strategies, fantasy cricket, and sports analytics.
Whether you're looking to scrape Sports data for deep statistical modeling or aiming to scrape popular IPL data for real-time insights, Python-based tools make it highly accessible. As cricket increasingly embraces technology, integrating web scraping with Python will continue to shape the future of the sport, empowering stakeholders to make informed decisions and elevate the IPL’s competitive landscape. Embrace the potential of OTT Scrape to unlock these insights and stay ahead in the competitive world of streaming!
Know More: https://www.ottscrape.com/web-scraping-ipl-data-player-performance-python.php
Note: IndiBlogHub features both user-submitted and editorial content. We do not verify third-party contributions. Read our Disclaimer and Privacy Policyfor details.


