Visualizing Complex Data: How Animation Simplifies Insights
-
- August 23rd, 2025
- 143 views

Get a free topical map and start building content authority today.
In today’s digital age, data is everywhere. From healthcare and finance to marketing and education, companies are collecting more data than ever before. But here’s the real challenge—understanding it. Raw numbers and spreadsheets aren’t exactly exciting to look at, and for most people, they’re just plain confusing. So how do you turn complex data into something people can easily understand, and maybe even enjoy watching? The answer lies in animation.
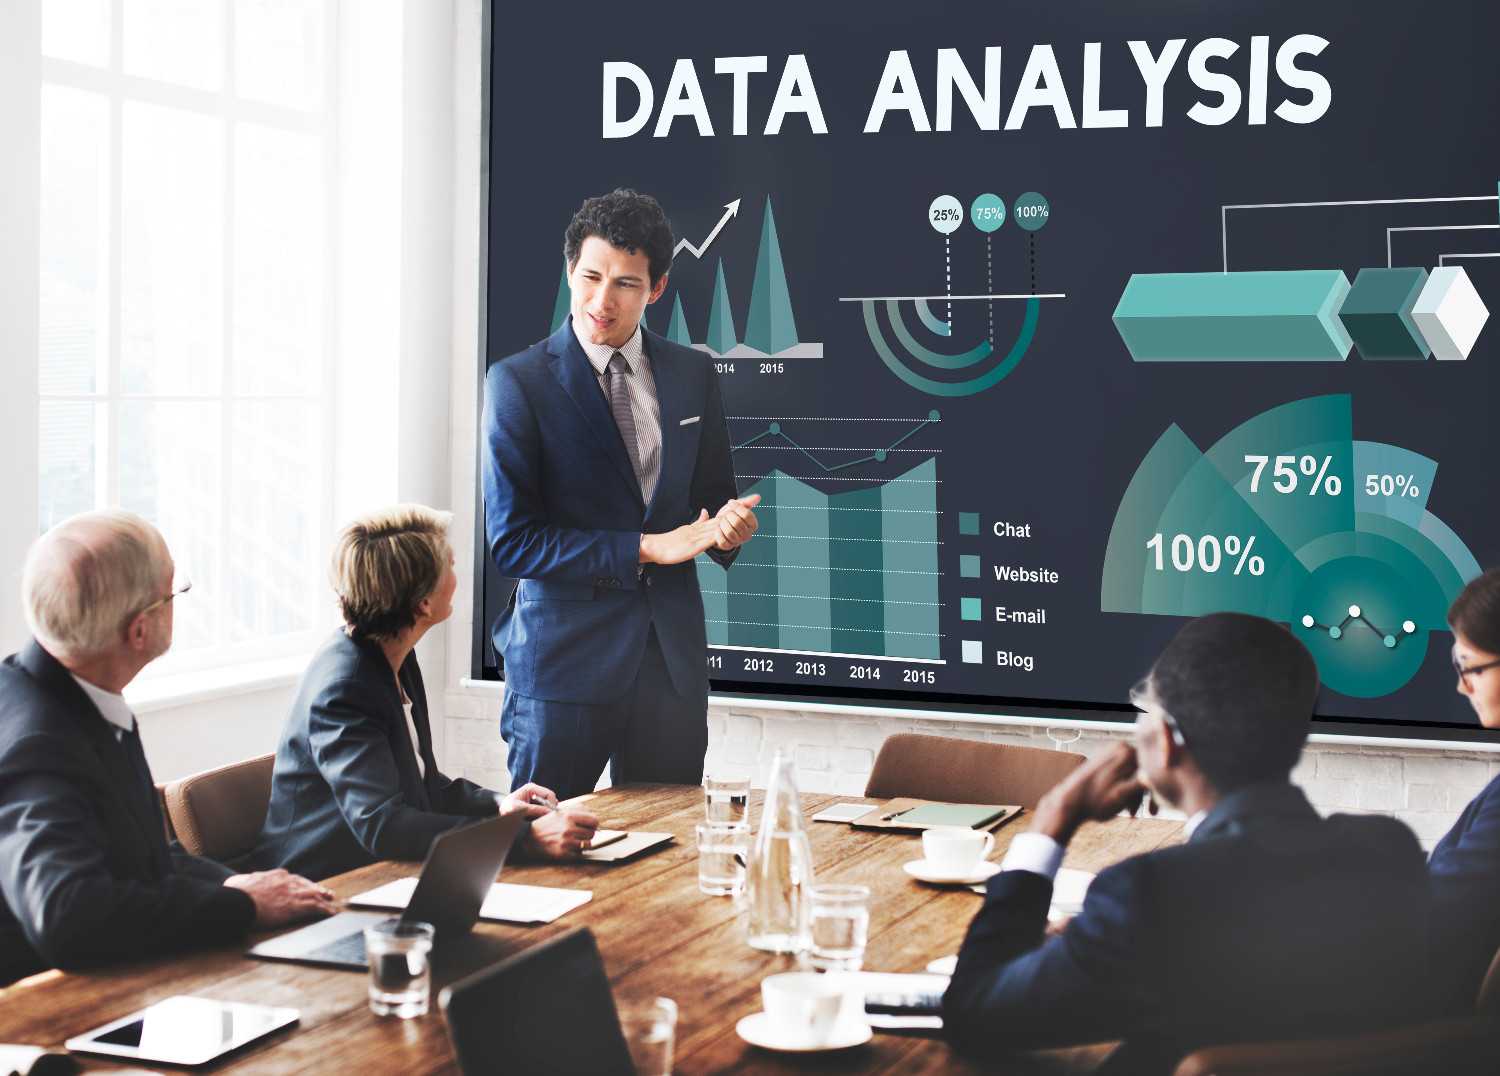
Why Data Visualization Matters
Let’s face it: people don’t connect with charts and graphs the way they do with stories. Our brains are hardwired to absorb information visually and emotionally. That’s why animation is such a powerful tool for data storytelling—it turns abstract information into visual stories that make sense and stick.
Imagine presenting quarterly performance results to a team. You could share a massive spreadsheet filled with figures—or you could bring that data to life through animated visuals. Which one do you think people will pay more attention to? That’s the power of animation: it simplifies without dumbing things down.
How Animation Helps Simplify Complex Information
Animation does more than just add movement to visuals. It allows data to be broken down and rebuilt in ways that highlight key points and show patterns that might otherwise be missed. Here's how it works:
Contextual Clarity: With animation, you can zoom in on important trends, show comparisons, and even simulate outcomes. This gives viewers a clearer understanding of what the data actually means.
Emotional Engagement: Movement, color, sound, and design—animation uses all of these elements to draw in your audience. When viewers are emotionally engaged, they’re more likely to retain the information.
Narrative Flow: Unlike static graphs, animations can guide viewers through a storyline. Instead of being overwhelmed with everything at once, they’re taken on a journey—step by step—so they can absorb the data naturally.
Real-World Use Cases
Organizations around the world are using animation to make complex data easier to grasp:
Healthcare: Animated explainer videos help patients understand medical procedures and data from health reports. Visualizing recovery rates or medication usage patterns can be far more effective than medical charts.
Finance: Investment firms are using animation to illustrate financial growth, market predictions, and budgeting strategies—cutting through jargon and making financial literacy more approachable.
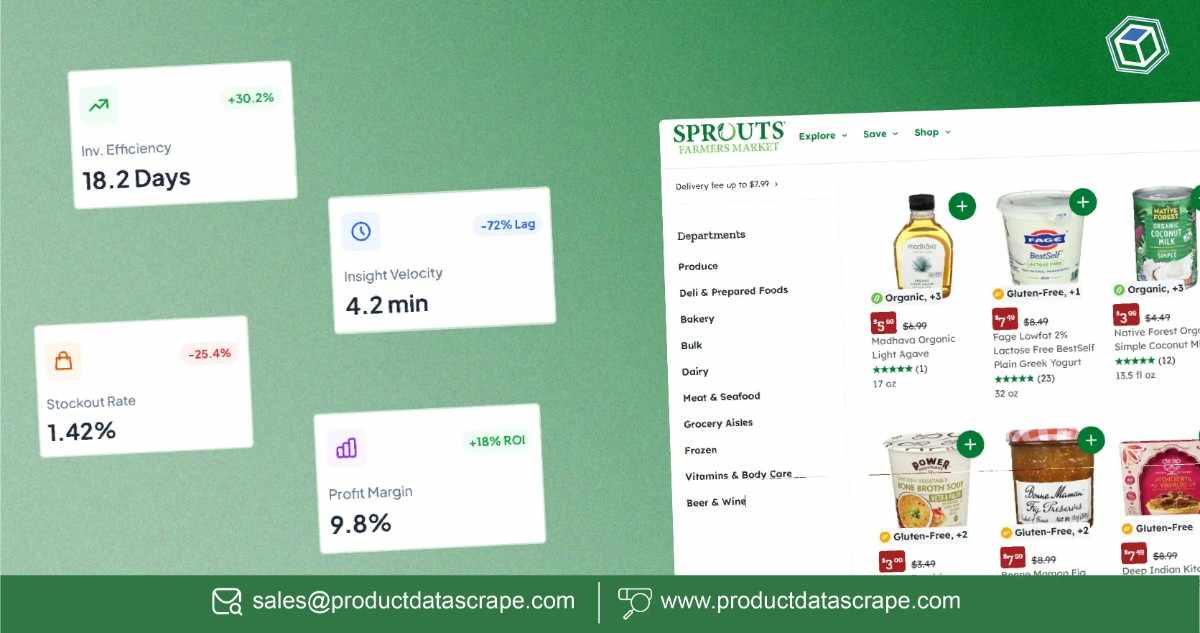
Marketing: Animation allows marketers to showcase analytics and customer insights in ways that resonate with non-technical stakeholders. Animated dashboards or explainer videos help teams make quicker, more informed decisions.
Why Businesses Are Turning to Animation Studios
Creating animated data visuals takes more than basic design skills. It involves storytelling, design thinking, technical animation, and an understanding of the data itself. That’s why many companies turn to experts—especially a specialized animation studio in New York, where creativity meets high-end production.
These studios are home to talented teams that know how to make numbers dance, literally. From startups to global enterprises, businesses partner with animation studios to transform dry data into engaging visual experiences that can be used across presentations, websites, training sessions, and social media.
The Role of 3D Animation in Data Visualization
When it comes to data storytelling, 3D animation takes things to another level—literally. It offers depth and realism that 2D graphics simply can’t match. Want to show the architecture of a smart city project with layered data on energy usage, traffic flow, and pollution? 3D animation brings that to life.
More companies are tapping into 3D animation services to create high-impact visuals for product development, research presentations, and even internal reports. It's not just about looking cool—it’s about delivering insights in a way that sticks with the viewer.
What Makes Animation So Effective?
There’s a psychology behind why animated visuals work so well:
Reduced Cognitive Load: Animation simplifies content by showing just one point at a time. It reduces the mental effort required to process large amounts of information.
Better Retention: Visual and motion cues help encode data in our long-term memory. People remember 80% of what they see and do, compared to only 20% of what they read.
Accessibility: Whether you’re speaking to data scientists or non-technical stakeholders, animation speaks a universal language. It makes data accessible to everyone.
Finding the Right Animation Partner
Not all animations are created equal. To bring data to life effectively, businesses need to work with professionals who understand both creative storytelling and technical accuracy. Leading computer generated imagery companies offer the perfect blend of both worlds. They use the latest technology to render dynamic scenes, integrate real-time data, and customize visuals to fit different industries.
Whether you need a simple animated infographic or a full-scale 3D data environment, a professional partner ensures your vision is not only realized but elevated.
Final Thoughts
Data is powerful, but only if people can understand it. Animation bridges that gap, turning complexity into clarity. With the right mix of creativity, strategy, and technology, animation transforms how businesses communicate and make decisions.
As attention spans shrink and data grows more complex, animated visuals are no longer a “nice to have”—they’re essential. So, the next time you’re staring at a mountain of charts and figures, ask yourself: “What story am I trying to tell?” Then consider telling it with animation. Your audience—and your bottom line—will thank you.