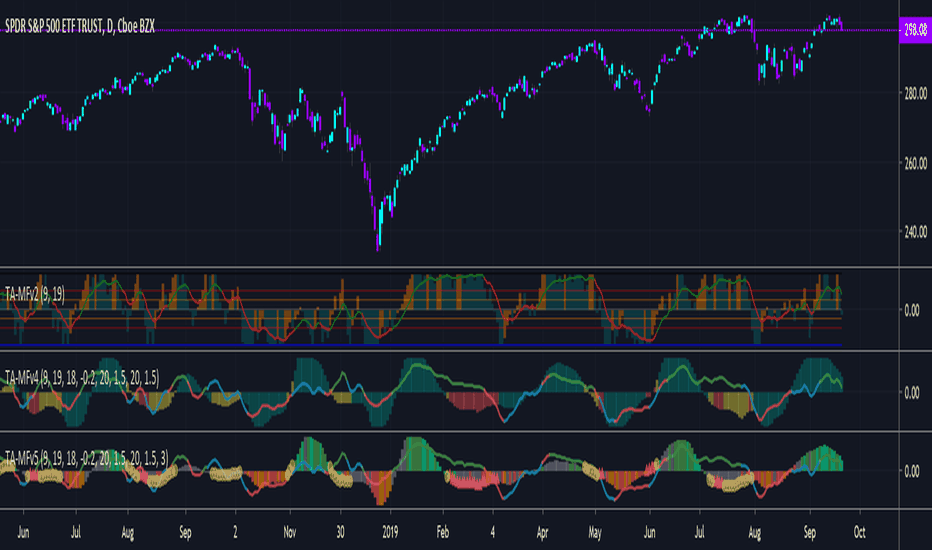
Unlocking Trading Success with Moving Average Convergence Divergence (MACD): Understanding Market Trends

Strong 8k brings an ultra-HD IPTV experience to your living room and your pocket.
In the ever-evolving landscape of financial markets, traders and analysts are perpetually on the lookout for tools and techniques that offer advantages in identifying market trends and executing profitable trades. One of the most powerful and widely-used indicators in this realm is the Moving Average Convergence Divergence, commonly known by its acronym MACD. Renowned for its capability to unravel intricate market dynamics, MACD has carved a niche for itself as a cornerstone in the toolkit of both novice and seasoned traders.
Understanding MACD
The Moving Average Convergence Divergence (MACD) is a trend-following momentum indicator that demonstrates the relationship between two moving averages of a security's price. Developed by Gerald Appel in the late 1970s, the MACD has become one of the most reliable and versatile tools in technical analysis.
At its core, the MACD comprises three primary components:
1. MACD Line: This is calculated by subtracting the 26-period Exponential Moving Average (EMA) from the 12-period EMA. The MACD line responds quickly to price changes, offering insights into short-term trends.
2. Signal Line: The Signal line is generally a 9-period EMA of the MACD line. By smoothing out price movements, it functions as a trigger line, signaling potential buy or sell opportunities when it intersects with the MACD line.
3. Histogram: The histogram is the graphical representation of the distance between the MACD line and the Signal line. Positive values suggest bullish momentum, while negative values indicate bearish momentum.
How MACD Helps Traders
In trading, identifying market trends is a critical skill that can significantly influence a trader's success. MACD helps traders discern these trends by providing signals of potential bullish or bearish shifts. Here’s how:
- Crossovers: When the MACD line crosses above the Signal line, it suggests a bullish trend, indicating a potential buy opportunity. Conversely, when the MACD line crosses below the Signal line, it implies a bearish trend, heralding a potential sell signal.
- Divergence: Divergence occurs when the security’s price diverges from the MACD line. This can signal a pending reversal, prompting traders to reassess their strategies.
- Overbought/Oversold Conditions: By analyzing the distance between the MACD line and the Signal line, traders can ascertain the market's momentum and discern potential overbought or oversold conditions.
Multi-Timeframe (MTF) Analysis: Expanding MACD’s Utility
While MACD is highly effective on its own, its capability is significantly enhanced when integrated with Multi-Timeframe (MTF) analysis. By examining MACD signals across different timeframes, traders can gain a more comprehensive view of market dynamics, boost their confidence in decision-making, and improve trade accuracy.
The Importance of MTF Analysis
Multi-Timeframe analysis involves reviewing the MACD across several chart intervals simultaneously, such as daily, weekly, and monthly charts. This approach provides a holistic view of a security's trend, making it easier to identify prevailing long-term trends while catching short-term fluctuations.
Here's how MTF analysis can be advantageous:
- Enhanced Clarity: Observing MACD’s behavior over multiple timeframes allows traders to confirm trends. A bullish signal on both daily and weekly MACD charts, for instance, offers greater assurance than a single timeframe signal.
- Trend Consistency: MTF analysis aids in identifying trend consistency across timeframes. It helps traders determine whether a movement on a smaller time frame aligns with the broader trend.
- Timing Better Entries and Exits: Analyzing MACD signals across different timeframes enables traders to better time their entry and exit points, capitalizing on periods of volatility or stability.
Real-World Application: MACD in Action
Consider a trader monitoring the MACD of a stock XYZ. On the daily chart, the MACD line crosses above the Signal line, suggesting a potential bullish momentum. Simultaneously, weekly MACD shows that the MACD line is approaching the Signal line. The trader interprets these signals as a convergence towards a bullish scenario. With MTF analysis, the trader decides to purchase shares of XYZ, anticipating an upward movement confirmed by the alignment of signals across varied timeframes.
Shortly after, the MACD histogram on both daily and weekly charts begins to taper, indicating diminishing bullish momentum. The trader assesses this convergence, decides to lock in profits, and exits the position before any significant reversal occurs. This scenario demonstrates the powerful synergy between MACD and MTF analysis in optimizing trading decisions.
Challenges and Considerations
While MACD, paired with MTF analysis, presents numerous advantages, it’s essential for traders to remain aware of several challenges and considerations:
- Lagging Nature: As a moving average-based indicator, MACD may lag behind price movements. This means that traders need to exercise patience and not rely solely on MACD signals without considering market conditions and complementary indicators.
- Whipsaws: False signals, or whipsaws, can occur, particularly in volatile or sideways markets. Traders must be prepared to manage risk and use MACD in conjunction with other analytical tools.
- Complexity with MTF: Multi-Timeframe analysis requires additional time and assessment, which may increase complexity in trading decisions. Traders should practice clear strategy development and consistent monitoring.
Conclusion: Embracing MACD’s Potential
Moving Average Convergence Divergence stands as a robust and versatile tool in technical analysis, empowering traders to decode market trends with greater precision and confidence. The integration with Multi-Timeframe (MTF) analysis elevates its efficacy, allowing traders to perceive a broader, more detailed picture of market dynamics. As with any trading tool, utilizing MACD effectively requires practice, patience, and a deep understanding of its nuances.
By mastering MACD, traders unlock the potential to navigate financial markets with an informed strategy, maximizing opportunities while minimizing risks. As markets continue to evolve, MACD’s adaptability remains unwavering, securing its position as a quintessential component in the trader’s arsenal, propelling them towards informed and successful trading ventures.
Note: IndiBlogHub features both user-submitted and editorial content. We do not verify third-party contributions. Read our Disclaimer and Privacy Policyfor details.


