Maximizing Efficiency with Grafana Open Source Dashboards
-

- August 23rd, 2025
- 303 views

Strong 8k brings an ultra-HD IPTV experience to your living room and your pocket.
In today's data-driven world, organizations are constantly seeking ways to maximize efficiency through insightful data analysis and visualization. Grafana Open Source dashboards have emerged as a powerful tool in this quest, offering robust features and unparalleled flexibility for monitoring and visualizing a wide range of data sources.
What is Grafana Open Source?
Grafana Open Source is a widely-used open-source platform for monitoring and observability. It allows users to create interactive and dynamic dashboards that display data from various sources, such as databases, cloud services, and other monitoring tools. With Grafana, users can transform raw data into meaningful insights through customizable visualizations, including graphs, charts, heatmaps, and more.
Key Features of Grafana Open Source
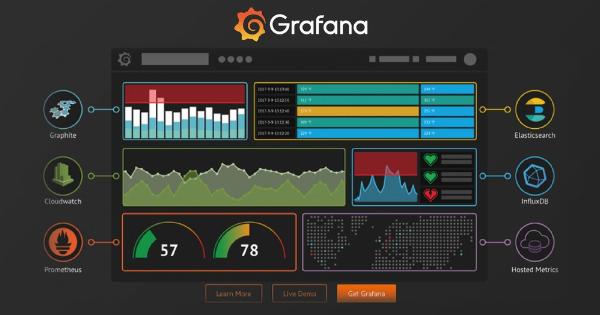
1. Wide Range of Data Sources: Grafana Open Source supports a multitude of data sources, including Prometheus, Graphite, InfluxDB, Elasticsearch, MySQL, PostgreSQL, and many others. This flexibility allows organizations to integrate diverse data streams into a single dashboard.
2. Customizable Dashboards: Users can tailor their dashboards to meet specific needs. Grafana's intuitive interface allows for easy creation and modification of panels, enabling users to visualize data in the most effective way.
3. Alerting System: Grafana Open Source includes a sophisticated alerting mechanism that notifies users when certain conditions are met. This feature is crucial for proactive monitoring and ensures timely responses to potential issues.
4. Plugin Ecosystem: Grafana's plugin ecosystem extends its functionality by offering additional data sources, panel types, and app integrations. This adaptability ensures that Grafana can evolve with the changing needs of an organization.
5. Annotations and Reporting: Users can add annotations to highlight specific events or periods in their data, making it easier to correlate trends and anomalies. Grafana also supports scheduled reporting, allowing users to share insights with stakeholders regularly.
Maximizing Efficiency with Grafana Open Source
1. Centralized Monitoring: By consolidating data from various sources into a single Grafana dashboard, organizations can streamline their monitoring processes. This centralized view simplifies data analysis and reduces the time spent switching between different tools.
2. Enhanced Data Visibility: Grafana's dynamic and interactive visualizations enable users to gain deeper insights into their data. By customizing dashboards to highlight key performance indicators (KPIs), teams can quickly identify trends, patterns, and anomalies.
3. Proactive Issue Resolution: The alerting system in Grafana Open Source ensures that teams are promptly notified of potential issues. By setting up alerts based on critical metrics, organizations can address problems before they escalate, minimizing downtime and enhancing operational efficiency.
4. Improved Collaboration: Grafana dashboards can be shared with team members and stakeholders, fostering collaboration and informed decision-making. The ability to annotate and generate reports further enhances communication and transparency.
5. Scalability and Flexibility: Grafana Open Source's plugin ecosystem and wide range of supported data sources make it a versatile solution for organizations of all sizes. Whether monitoring a small set of metrics or a complex infrastructure, Grafana can scale to meet evolving needs.
Conclusion
Grafana Open Source dashboards are an invaluable asset for organizations looking to maximize efficiency through data-driven insights. With its robust features, customizable visualizations, and seamless integration with various data sources, Grafana empowers teams to monitor, analyze, and act on their data effectively. By leveraging Grafana Open Source, organizations can enhance their operational efficiency, improve decision-making, and stay ahead in today's competitive landscape.
Related Posts


Note: IndiBlogHub features both user-submitted and editorial content. We do not verify third-party contributions. Read our Disclaimer and Privacy Policyfor details.