Top 10 SAP Analytics Cloud Features Every SAP Service Team Should Use
-

- Published Updated
- 78 views
Introduction to SAP Analytics Cloud
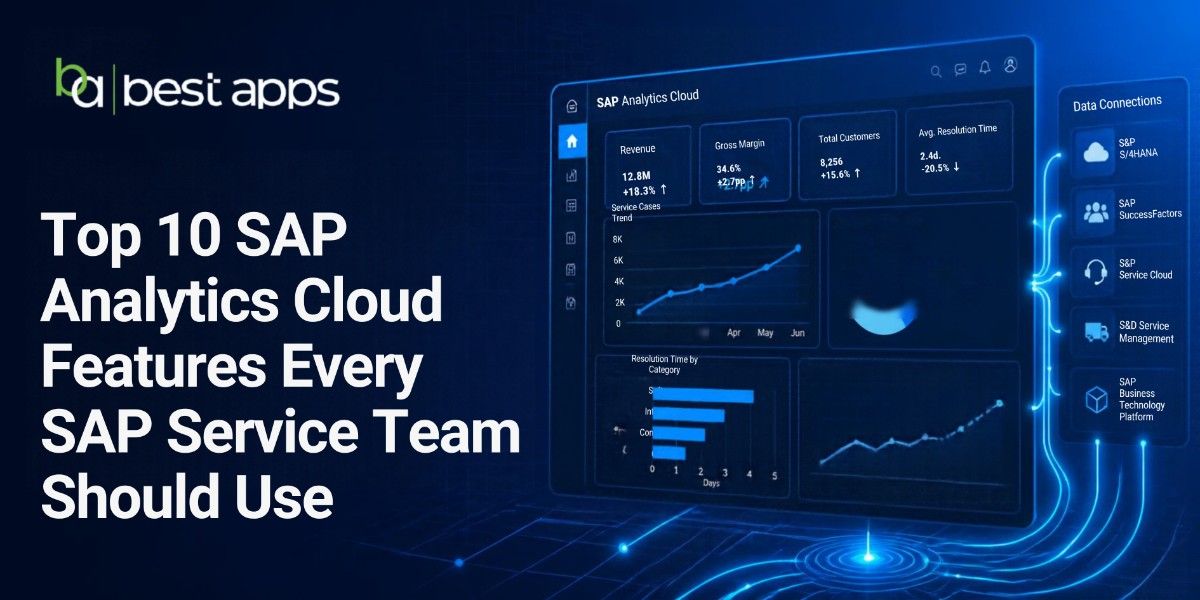
SAP Analytics Cloud (SAC) combines business intelligence, predictive analytics, and enterprise planning in one cloud-based solution. For SAP service teams, it can help improve reporting, monitor business performance, identify trends, and support data-driven decisions. Its integration capabilities also help teams analyze information from SAP and other business data sources.
Top 10 SAP Analytics Cloud Features
1. Interactive Dashboards and Stories
Create interactive dashboards to monitor key performance indicators (KPIs), project progress, and business results. Stories help teams explore data and share findings with stakeholders.
2. Data Visualization and Reporting
Convert complex business data into charts, tables, and visual reports. This makes it easier for SAP consultants and managers to identify performance gaps and communicate results.
3. Live Data Connectivity
Connect to supported SAP data sources, including SAP S/4HANA and SAP Datasphere, to analyze business information while reducing unnecessary data duplication.
4. Smart Insights
Use Smart Insights to investigate data points and understand factors that may explain changes in business performance. This helps teams move beyond simply viewing numbers.
5. Smart Predict
Use predictive analytics to explore possible future trends based on historical data. Service teams can apply forecasting to support planning and improve business decisions.
6. Smart Discovery
Explore datasets to identify relationships, patterns, and potential outliers that may not be immediately visible in standard reports.
7. Planning and Forecasting
Support budgeting, forecasting, and scenario planning in one environment. Teams can compare actual performance with planned targets and adjust future plans.
8. Data Modeling
Organize business information using models, dimensions, and measures. Well-structured data helps teams build consistent reports and analyze relevant business metrics.
9. Collaboration and Sharing
Share stories and reports with authorized colleagues to improve communication between consultants, managers, and business stakeholders.
10. Microsoft Excel Integration
Use supported Microsoft Excel integration capabilities to analyze SAP Analytics Cloud data in familiar spreadsheet workflows, helping teams work more efficiently.
Conclusion
Using the right SAP Analytics Cloud features can help SAP Service teams improve reporting, monitor KPIs, forecast business needs, and make informed decisions. By combining interactive dashboards, smart analytics, planning, and collaboration, organizations can turn business data into actionable insights. The best approach is to select features that align with your reporting requirements, business goals, and existing SAP landscape.
1. Interactive Dashboards and Stories
Create interactive dashboards to monitor key performance indicators (KPIs), project progress, and business results. Stories help teams explore data and share findings with stakeholders.
2. Data Visualization and Reporting
Convert complex business data into charts, tables, and visual reports. This makes it easier for SAP consultants and managers to identify performance gaps and communicate results.
3. Live Data Connectivity
Connect to supported SAP data sources, including SAP S/4HANA and SAP Datasphere, to analyze business information while reducing unnecessary data duplication.
4. Smart Insights
Use Smart Insights to investigate data points and understand factors that may explain changes in business performance. This helps teams move beyond simply viewing numbers.
5. Smart Predict
Use predictive analytics to explore possible future trends based on historical data. Service teams can apply forecasting to support planning and improve business decisions.
6. Smart Discovery
Explore datasets to identify relationships, patterns, and potential outliers that may not be immediately visible in standard reports.
7. Planning and Forecasting
Support budgeting, forecasting, and scenario planning in one environment. Teams can compare actual performance with planned targets and adjust future plans.
8. Data Modeling
Organize business information using models, dimensions, and measures. Well-structured data helps teams build consistent reports and analyze relevant business metrics.
9. Collaboration and Sharing
Share stories and reports with authorized colleagues to improve communication between consultants, managers, and business stakeholders.
10. Microsoft Excel Integration
Use supported Microsoft Excel integration capabilities to analyze SAP Analytics Cloud data in familiar spreadsheet workflows, helping teams work more efficiently.
1. Interactive Dashboards and Stories
Create interactive dashboards to monitor key performance indicators (KPIs), project progress, and business results. Stories help teams explore data and share findings with stakeholders.
2. Data Visualization and Reporting
Convert complex business data into charts, tables, and visual reports. This makes it easier for SAP consultants and managers to identify performance gaps and communicate results.
3. Live Data Connectivity
Connect to supported SAP data sources, including SAP S/4HANA and SAP Datasphere, to analyze business information while reducing unnecessary data duplication.
4. Smart Insights
Use Smart Insights to investigate data points and understand factors that may explain changes in business performance. This helps teams move beyond simply viewing numbers.
5. Smart Predict
Use predictive analytics to explore possible future trends based on historical data. Service teams can apply forecasting to support planning and improve business decisions.
6. Smart Discovery
Explore datasets to identify relationships, patterns, and potential outliers that may not be immediately visible in standard reports.
7. Planning and Forecasting
Support budgeting, forecasting, and scenario planning in one environment. Teams can compare actual performance with planned targets and adjust future plans.
8. Data Modeling
Organize business information using models, dimensions, and measures. Well-structured data helps teams build consistent reports and analyze relevant business metrics.
9. Collaboration and Sharing
Share stories and reports with authorized colleagues to improve communication between consultants, managers, and business stakeholders.
10. Microsoft Excel Integration
Use supported Microsoft Excel integration capabilities to analyze SAP Analytics Cloud data in familiar spreadsheet workflows, helping teams work more efficiently.
1. Interactive Dashboards and Stories
Create interactive dashboards to monitor key performance indicators (KPIs), project progress, and business results. Stories help teams explore data and share findings with stakeholders.
2. Data Visualization and Reporting
Convert complex business data into charts, tables, and visual reports. This makes it easier for SAP consultants and managers to identify performance gaps and communicate results.
3. Live Data Connectivity
Connect to supported SAP data sources, including SAP S/4HANA and SAP Datasphere, to analyze business information while reducing unnecessary data duplication.
4. Smart Insights
Use Smart Insights to investigate data points and understand factors that may explain changes in business performance. This helps teams move beyond simply viewing numbers.
5. Smart Predict
Use predictive analytics to explore possible future trends based on historical data. Service teams can apply forecasting to support planning and improve business decisions.
6. Smart Discovery
Explore datasets to identify relationships, patterns, and potential outliers that may not be immediately visible in standard reports.
7. Planning and Forecasting
Support budgeting, forecasting, and scenario planning in one environment. Teams can compare actual performance with planned targets and adjust future plans.
8. Data Modeling
Organize business information using models, dimensions, and measures. Well-structured data helps teams build consistent reports and analyze relevant business metrics.
9. Collaboration and Sharing
Share stories and reports with authorized colleagues to improve communication between consultants, managers, and business stakeholders.
10. Microsoft Excel Integration
Use supported Microsoft Excel integration capabilities to analyze SAP Analytics Cloud data in familiar spreadsheet workflows, helping teams work more efficiently.