 Competitor Backlink Hack – Steal Their Traffic. Legally!
Written by Bryan » Updated on: June 12th, 2025

For many years, Datadog stood as a veteran heavyweight in the landscape of modern observability tools. Despite its impressive capabilities, many teams struggle with its pricing and complexity as their systems scale. Both startups and enterprises often find themselves at a crossroads where they look at several alternatives to Datadog, only to find themselves in deep decision paralysis.
Today, we’ll dive into the top 10 Datadog alternatives, giving you an extensive comparison so the next time you decide to pick an observability tool for your system, it’s a breeze picking the right one.
To look for the right Datadog alternative, in this guide, we’ll compare these alternatives based on:
● Ease of use: Is it quick to set up and has an intuitive UI that can be used by cross-functional teams in your organisation?
● Flexibility: The Level of customizability the tool offers and how it meets the diverse monitoring needs of your system
● Pricing: Transparent and scalable pricing models
● Integration capabilities: Does this tool have extensive support for modern cloud-native stacks?
● Highlights: Does this tool offer some specialised capabilities that can make a strong case for getting rid of Datadog?
● Weakness: Why would you want to stick with Datadog despite this tool’s numerous advantages?
We’ll dive deeper into each alternative, understand its pros and cons, and use cases where it fits the best so you can make the most out of this comparison.

Middleware is built specifically for modern DevOps, SRES, and platform teams. It provides real-time metrics, logs, and traces alongside an intuitive and easy-to-use unified interface.
Unlike Datadog, it offers agentless deployment, making it extremely easy and fast to set up and get it running. It also has built-in support for cloud-native and Kubernetes environments with transparent pricing, so you know how the cost scales with the needs of your system.
Its core features also include:
● Real-Time APM (Application Performance Monitoring) – It tracks the most vital metrics for any application’s performance, such as latency, throughput, error rate, etc, in real-time
● Log Management – It collects and indexes logs and traces across your system and gives you an intuitive way to search these logs across various services for simplified troubleshooting
● Custom Dashboards – You can create flexible and custom dashboards to visually understand the vitals and metrics of your system
● Alerting & Notifications – You can configure Middleware to send intelligent alerts based on thresholds, anomalies, or predefined rules through Slack, email, or webhooks.
● OpenTelemetry Support – You can seamlessly integrate it with the OpenTelemetry standard to collect telemetry data across your stack
Middleware is the perfect choice for fast-growing SaaS startups due to "its ability to integrate with infrastructure and tools anywhere, including Cycle.io, AWS, and Kubernetes.". With features at par with Datadog but a much reduced level of complexity and clearer cost structures, it can be an ideal choice even for enterprises that want to move fast in the observability space.

New Relic sets its forte in application and infrastructure monitoring capabilities. It’s an ideal choice for large enterprises. It is well-suited for complex environments with diverse technology stacks, making it a powerful backend companion to enterprise-grade CRM and sales tools. Its powerful distributed tracing and end-to-end transaction visibility make it extremely valuable for monitoring microservices.
It also overpowers Datadog's AI-powered analytics capabilities and visualisation features, making complex data more actionable for engineering teams. However, this may involve more upfront investment in setup and configuration. New Relic's focus on OpenTelemetry standardisation gives it a forward-looking advantage for teams building future-proof observability strategies that want to prioritise monitoring telemetry data.
However, it’s not an ideal choice for smaller teams due to its steep learning curve. Moreover, organisations heavily invested in Kubernetes and containerised environments may find Datadog more suitable. It’s also pricier than Datadog, which gets even more apparent due to the high operational costs involved as your system’s architecture scales up in complexity.
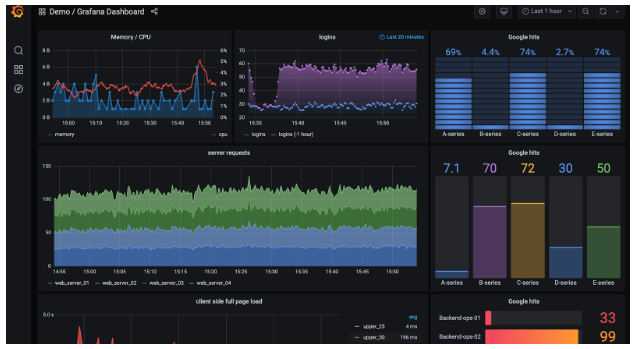
Our first open-source pick, which gives Datadog a neck-to-neck competition with its rich and intuitive UI for creating interactive dashboards and visualisations, is Grafana Cloud. You can get an even more well-rounded observability coverage using additional components like Loki for logs and Tempo for traces.
It’s well-suited for the needs of smaller teams, but it offers minimal alerting capabilities and can get quite expensive with extensive use. It also lacks some advanced metrics correlation features like Datadog does out of the box.
Grafana's pricing can appear extremely affordable but also get expensive with extensive metric ingestion and longer data retention periods. Unlike Datadog's predictable per-host pricing, Grafana's consumption-based model might lead to surprise bills as your monitoring needs grow, so it’s not well suited for teams with rapidly increasing complexity.
With strong real-time analytics capabilities, Splunk is an excellent security-focused Datadog alternative for enterprises that provides more granular visibility into potential threats. Splunk achieves this via its machine learning-powered anomaly detection, which identifies security incidents in real-time and can be valuable for compliance requirements.
However, due to a complex setup and resource-intensive nature, it has a steep cost. While its query language (SPL) provides powerful search capabilities, it presents a steeper learning curve than Datadog's more intuitive interface. Its data ingestion pricing model can also skyrocket for environments that must monitor a high volume of observability data.
Dynatrace is a popular monitoring tool known for it’s Davis AI engine, powerful AI-driven insights and automation capabilities. It provides automatic anomaly detection along with resolution, where it identifies root causes before they impact users. Its unified platform allows you to see dependency mapping for your entire system, simplifying troubleshooting for your support engineering teams.
Global platforms can utilize Dynatrace's AI capabilities to manage their microservices architecture spanning multiple cloud providers. Large-scale enterprises find it a lifesaver against traditional manual monitoring with Datadog.
Its biggest pain point is its steeper learning curve as compared to Datadog’s more intuitive observability experience. Moreover, its pricing demands a higher initial investment than Datadog so teams with initial budget constraints may not get a chance to try it in the first place. Smaller teams or those prioritising quick adoption might find Datadog's balance of features and usability more appropriate for their needs.
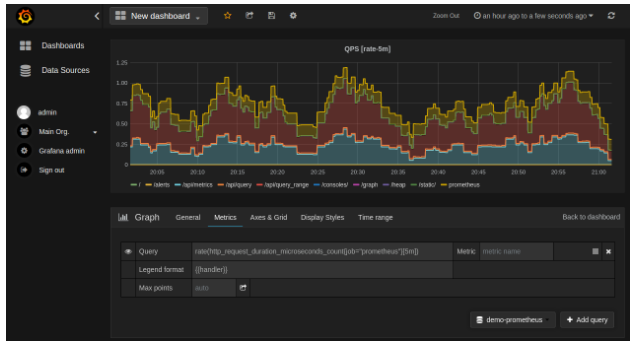
This duo offers a completely open-source, highly flexible monitoring solution which is extremely useful for Kubernetes-native environments, thanks to Prometheus' ground-up support for containerised environments. Using Prometheus’ query language, called PromQL, you get more flexibility than Datadog for running queries on top of your observability data.
The self-hosted nature gives you control over your monitoring infrastructure and data retention policies, which are missing in Datadog’s SaaS only approach.
However, the maintenance and expertise needed to deploy, scale and manage this system are cumbersome. This operational overhead grows exponentially with scale, and the lack of out-of-the-box integrations can make a good case for Datadog to be a better pick in this regard.
If your team lacks experience with making the best of self-hosted systems and prefers prioritising fast time-to-value, Datadog's managed approach is more economical.

The ideal observability platform for legacy systems, LogicMonitor offers hybrid infrastructure monitoring capabilities. With a more holistic visibility across your on-premise, cloud and legacy environments, you also save a ton of time in the initial setup by leveraging its built-in templates.
LogicMonitor focuses primarily on infrastructure health rather than code-level insights. Hence, teams that are concerned with infrastructure reliability and uptime can extract great value for money.
However, the absence of application performance monitoring makes Datadog a better choice as a comprehensive observability platform for organisations with large development teams and complex software applications.
Backed by Cisco, AppDynamics has long been the go-to observability platform for Java and .NET ecosystems due to its granular code-level visibility. It goes the extra mile by mapping business connections with technical performance, giving you an analysis that can be directly used to improve your business metrics using AI-powered business intelligence features. Furthermore, its root cause analysis is more advanced for complex enterprise applications as compared to Datadog's.
In our opinion, if you want to tap into broader Cisco infrastructure management solutions, AppDynamics is the best Datadog alternative. It also provides extensive support for legacy applications with monolithic architectures.
The only downsides are that it’s pricier than Datadog and has a more time-consuming onboarding requiring a much steeper learning curve, especially if you’re not using any Cisco infrastructure in your system already.
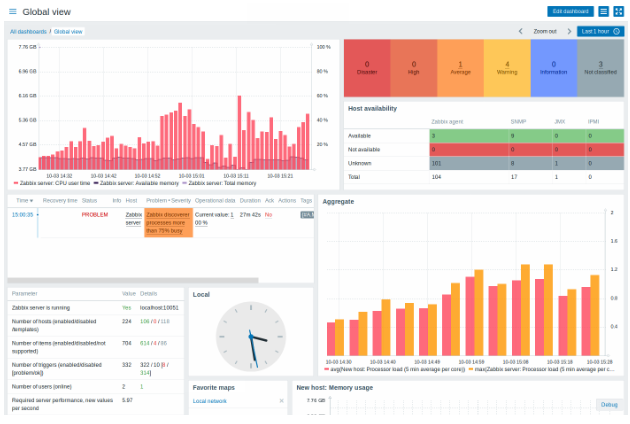
Zabix is the most cost-effective open-source Datadog alternative on this list. Where Datadog’s predictable per-host pricing model is known to be expensive, Zabix provides unlimited monitoring with zero licensing costs, regardless of your scale.
Like LogicMonitor, it also provides monitoring templates to standardise observability across large homogeneous environments. For organisations with substantial on-premises infrastructure, limited cloud adoption, and in-house Linux expertise, Zabbix offers unbeatable value.
However, Zabbix’s advantages come at the cost of greater configuration complexity compared to Datadog's streamlined setup. With an outdated user interface it lacks the intuitive experience of a modern observability platform that Datadog provides. It’s limited in its cloud-native integrations and struggles with Kubernetes environments.
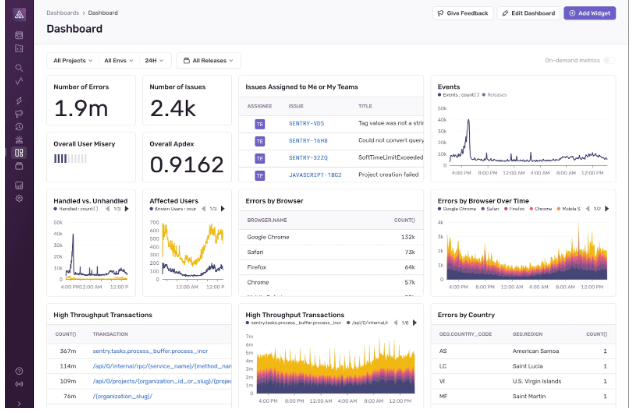
Sentry is hands down the most popular and go-to choice for monitoring user-facing or client-side web and mobile applications. With features like source map support, release tracking, and session replays, it helps developers and engineering teams discover, debug, and prioritise bugs based on actual user impact.
It provides context-rich stack traces alongside integrations with development workflows to accelerate the debugging process. The best part is that it only takes a minute to set up using its SDK implementation, and you can even send custom alerts and logging from any part of your codebase.
For application monitoring focused on client-side applications, Sentry is the best Datadog alternative. However, if you want a simplified observability platform with less specialised frontend capabilities and an all-in-one solution for your monitoring needs, Datadog is still a better choice.
Comparison Table
Here’s a complete comparison table that can help you decide which Datadog alternative can suit your observability needs the best:
Feature Middleware New Relic Grafana Cloud Splunk Observability Cloud Dynatrace Prometheus + Grafana (Self-hosted) LogicMonitor AppDynamics Zabbix Sentry
Ease of Use ✅ ❌ ✅ ❌ ❌ ❌ ✅ ❌ ❌ ✅
Flexibility ✅ ✅ ✅ ✅ ✅ ✅ ❌ ✅ ❌ ✅
Pricing Transparency ✅ ❌ ❌ ❌ ❌ ✅ ✅ ❌ ✅ ✅
Integration Capabilities ✅ ✅ ✅ ✅ ✅ ✅ ❌ ✅ ❌ ✅
Highlights Agentless, Cycle.io integration, Kubernetes & AWS support Advanced APM, AI-powered analytics Open-source, customizable UI Real-time security analytics AI-powered automation Open-source, PromQL flexibility Easy setup, infrastructure-focused Deep Java/.NET APM Free, unlimited monitoring Frontend & mobile error tracking
Weaknesses: High cost, steep learning curve . Limited alerting, unpredictable cost, Complex setup, high resource usage, Steep learning curve, high initial cost, Operational overhead, lacks APM, less customizable, Expensive, complex onboarding, Outdated UI, limited cloud integration, Limited infrastructure coverage.
Datadog, while powerful, can be overwhelming and costly for many growing teams. Multiple solutions are emerging as balanced alternatives for Datadog, offering comprehensive observability, simplicity, scalability, and transparent pricing. For modern teams that want powerful insights without complexity, Middleware stands out as the top choice.
Note: IndiBlogHub features both user-submitted and editorial content. We do not verify third-party contributions. Read our Disclaimer and Privacy Policyfor details.
Sponsored Ad Partners


![]()


Copyright © 2019-2025 IndiBlogHub.com. All rights reserved. Hosted on DigitalOcean for fast, reliable performance.

