Practical Excel Data Analysis Toolkit for Business Users
-

- March 29th, 2026
- 141 views


FREE SEO Topical Map Generator: Find Your Next Content Ideas
Excel data analysis for business users requires a reliable process, the right functions, and discipline to avoid common errors. This guide provides a practical, step-by-step workflow, a compact checklist, an industry framework, and concrete tips to make routine business analysis faster and more accurate.
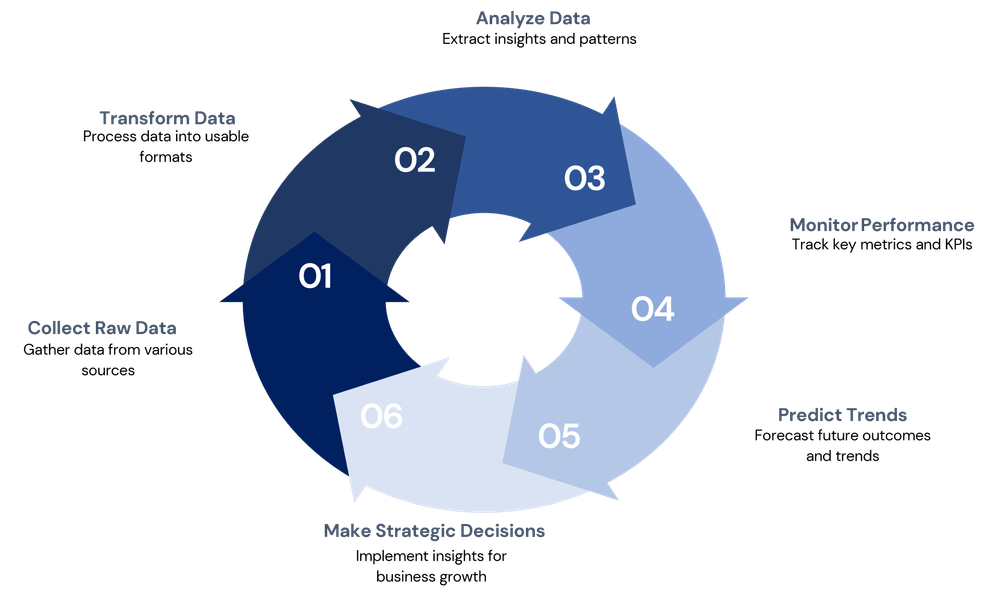
Follow a structured process: define the question, get and clean the data, analyze with PivotTables and functions, visualize results, and validate findings. Use the included Excel Analysis Checklist and CRISP-DM framework to stay consistent.
Excel data analysis for business users: quick workflow
Step-by-step actions
- Clarify the objective: state the question, metric, time period, and audience.
- Collect the data: import files, connect to reports, or copy from systems. Prefer consistent CSV, XLSX, or direct query exports.
- Clean and standardize: remove duplicates, normalize date formats, and handle missing values.
- Model and calculate: build PivotTables, use formulas (SUMIFS, XLOOKUP, INDEX/MATCH), or use Power Query for transformations.
- Visualize and summarize: create charts, conditional formatting, and a short executive table showing key metrics and drivers.
- Validate and document: cross-check totals, add a data sources sheet, and note assumptions for the audience.
Named framework: CRISP-DM (adapted)
Use CRISP-DM stages to structure analysis: Business Understanding, Data Understanding, Data Preparation, Modeling, Evaluation, and Deployment. For routine business reports, focus on Business Understanding → Data Preparation → Modeling → Evaluation.
Excel Analysis Checklist (compact)
- Objective defined (metric, period, audience)
- Raw data snapshot saved (read-only archive)">
- Standardized dates and IDs
- Dedupe and missing-value rules applied
- Key calculations in separate, labeled cells
- PivotTables built from a clean table/range
- Documented assumptions and validation tests
Key functions, tools, and related concepts
Common Excel features that speed analysis: PivotTables, Power Query (Get & Transform), structured tables, XLOOKUP/INDEX-MATCH, SUMIFS/AVERAGEIFS, dynamic arrays (FILTER, UNIQUE), and charts. Related entities: data model, Power Pivot, macros (VBA) or Office Scripts for automation, and basic database concepts like joins and primary keys.
Practical tips (3–5 actionable points)
- Always convert raw ranges to a Table (Ctrl+T). Tables preserve formulas and make PivotTables robust.
- Use Power Query for repetitive cleaning: create one query, parameterize file paths, and refresh rather than repeating manual steps.
- Pin a validation cell with the record count and a checksum (SUM of a stable numeric field) to detect unexpected changes after refreshes.
- Name critical ranges and output cells so formulas read clearly (Formulas > Define Name).
- Lock and protect final report sheets and keep a clear 'raw_data' tab separate from calculations.
Short real-world example: monthly revenue variance
A regional finance analyst needs month-over-month revenue variance by product line. Steps: import sales extract, convert to Table, standardize date to month, remove cancelled orders, create a PivotTable with Product Line and Month, add calculated field for variance using GETPIVOTDATA or formulas linked to the Pivot. Document the extraction query and keep a 'checks' sheet comparing total revenue to the source system.
Trade-offs and common mistakes
- Overusing formulas on raw ranges instead of Tables: slows workbooks and breaks when rows change. Use Tables and structured references.
- Embedding manual transformations in cells instead of Power Query: hard to reproduce and error-prone. Power Query improves reproducibility but has a learning curve.
- Relying on linked workbooks for live data: links can break. Prefer direct imports or a single source of truth file on shared storage.
- Not validating results: always reconcile totals to the source system to catch extraction or conversion issues.
Best practice reference
For official function documentation and examples, consult Microsoft Excel help for function references and feature guidance: Microsoft Excel help.
Frequently asked questions
What is Excel data analysis for business users and when should it be used?
Excel data analysis for business users is appropriate when datasets fit comfortably in Excel (typically tens to low hundreds of thousands of rows depending on hardware), when quick exploration, ad-hoc reporting, or rapid prototyping are needed. For very large datasets or production scoring, consider a database or dedicated BI tool.
When should a PivotTable be used instead of formulas?
Use PivotTables for fast aggregation, grouping, and ad-hoc slicing. Use formulas when row-level calculations, custom metrics, or cell-by-cell logic are required. PivotTables are faster to build but less flexible for complex row-level transformations.
How can data quality be validated in Excel?
Validate with row counts, unique-key checks, range-based checks (min/max), reconciliation to source totals, and spot checks on random rows. Use COUNTIFS and SUMIFS to compare subsets against expected values.
What are quick performance tips for large workbooks?
Limit volatile functions (NOW, INDIRECT), convert ranges to Tables, replace complex array formulas with helper columns, and consider using Power Pivot or moving the data model to a database for repeated heavy analysis.