Retail Analytics Tool: Choose, Measure, and Improve Sales Performance
-

- March 27th, 2026
- 186 views


FREE SEO Topical Map Generator: Find Your Next Content Ideas
A retail analytics tool transforms data from point-of-sale systems, e-commerce platforms, loyalty programs, and footfall counters into actionable insight for sales performance measurement. This guide explains which metrics matter, how to evaluate tools, and a practical implementation framework to get measurable results fast.
- Key metrics: same-store sales, conversion rate, average basket, gross margin, stock cover.
- Framework: R-AIM (Readiness, Acquire, Integrate, Measure) to deploy analytics consistently.
- Practical tips: start with high-impact KPIs, centralize data, validate sources, iterate reports.
Choosing the right retail analytics tool
Selecting a retail analytics tool depends on data sources, reporting cadence, and decision owners. Tools range from lightweight dashboards that pull sales and inventory to full BI platforms with predictive models and machine learning. Prioritize a tool that connects to core systems (POS, e-commerce, ERP, loyalty), supports the sales performance measurement cadence (daily/weekly/monthly), and exposes KPIs to store managers and finance.
Core metrics and data sources for sales performance measurement
Start with a concise set of metrics that align to revenue and margin goals. Typical metrics used in retail sales performance measurement include:
- Same-store sales (compared to prior period)
- Conversion rate (visits to transactions)
- Average transaction value / basket size
- Units per transaction and product affinity (basket analysis)
- Gross margin and markdown impact
- Inventory turnover and stock cover
- Channel attribution for omnichannel sales analytics (online vs. in-store)
Data sources: POS, e-commerce platform, inventory management, CRM/loyalty, footfall sensors, and promotions engine. Combining these creates reliable signals for evaluating promotions, regional performance, and store-level execution.
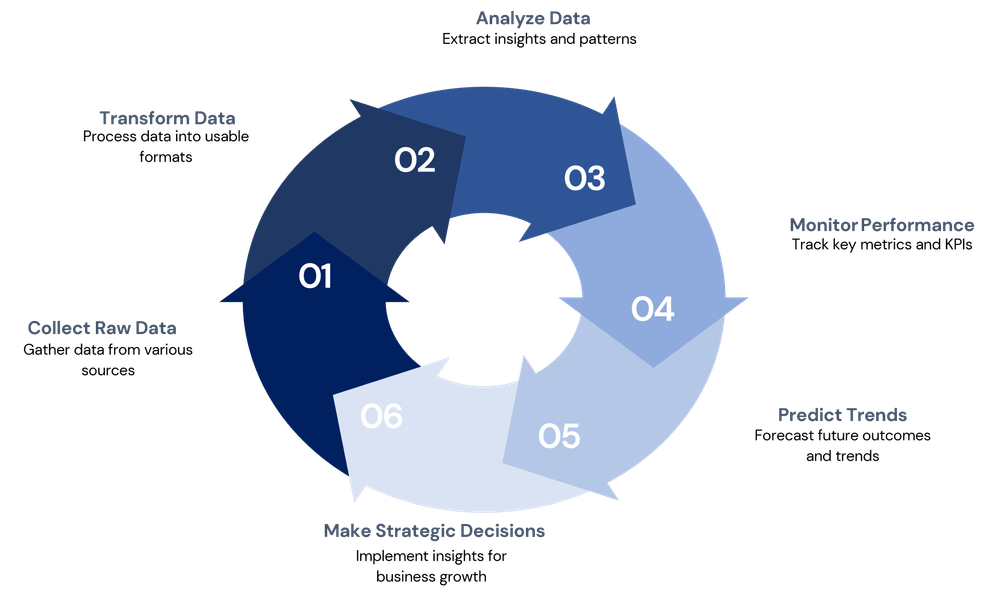
R-AIM framework: a checklist to implement retail analytics
Use the R-AIM framework to structure deployment and measure value:
- Readiness: catalog data sources, assign owners, and define KPIs.
- Acquire: connect systems (POS, e-commerce, ERP) and automate ingestion.
- Integrate: reconcile common dimensions (SKU, store, date), ensure master data quality.
- Measure: build dashboards, schedule reporting, and embed feedback loops for continuous improvement.
Checklist: data mapping, ETL jobs, validation tests, dashboard templates (executive, regional, store), access controls, and training materials.
Real-world example
A mid-size apparel chain used a retail analytics tool to combine POS, e-commerce, and promotions data. By tracking conversion rate and basket composition at the store level, merchandising changed assortments in underperforming locations. After implementing weekly dashboards and a prioritized action list, the chain improved same-store sales by 4% and reduced slow-moving SKUs by 12% within six months.
Practical tips to accelerate impact
- Focus on 3–5 high-impact KPIs first (e.g., same-store sales, conversion rate, margin) and expand later.
- Automate data feeds; manual CSVs slow adoption and increase error risk.
- Standardize identifiers (SKU, store code) across systems before analytics work begins.
- Design dashboards for decision roles: executives need trends and drivers; store managers need daily exception reports.
- Validate the data with a reconciliation routine (sales totals vs. finance, inventory counts vs. system) weekly.
Trade-offs and common mistakes
Trade-offs when selecting tools and approaches:
- Speed vs. accuracy: fast DIY dashboards can deliver quick wins but risk inconsistent definitions—budget time to reconcile metrics.
- Flexibility vs. governance: highly customizable platforms require stronger governance to prevent metrics drift.
- Cost vs. coverage: full BI implementations cover many use cases but need larger teams and longer timelines.
Common mistakes:
- Tracking too many KPIs without actually linking them to actions.
- Neglecting data quality and master data management; mismatched SKUs or dates produce misleading trends.
- Delivering dashboards without training or a process to act on exceptions.
Governance, compliance, and sources
Establish a small analytics governance group responsible for KPI definitions, data quality rules, and access controls. For retail best practices and industry benchmarks, the National Retail Federation provides resources on metrics and performance trends that can inform targets and benchmarking.
Implementation timeline (example)
A realistic rollout for a regional chain: 0–4 weeks for readiness and data inventory, 4–12 weeks to acquire and integrate core sources, 12–16 weeks to deliver initial dashboards and train users, and ongoing iterations every 4–8 weeks to add features and refine KPIs.
FAQ
What is a retail analytics tool and how does it support sales performance?
A retail analytics tool centralizes sales, inventory, and customer data to calculate performance metrics, identify trends, and surface opportunities for revenue or margin improvement. It supports sales performance measurement by turning raw transactions into KPIs and alerts that drive daily and strategic decisions.
Which KPIs are most effective for sales performance measurement?
Prioritize same-store sales, conversion rate, average basket value, gross margin, and inventory turnover. Use cohort and promotion lift analysis to understand campaign effectiveness.
How to integrate POS and e-commerce data for omnichannel insights?
Match customer and SKU identifiers across systems, timestamp transactions to a common timezone, and reconcile sales totals. Implement an ETL layer or data warehouse to create a single source of truth for omnichannel reporting.
What are common data quality checks for retail analytics?
Run routine checks for negative sales, duplicate transactions, missing SKUs, and reconciliation with financial reports. Automate alerts for anomalies and keep a log of data fixes for governance.
How should performance targets be set and reviewed?
Set targets based on historical performance, seasonality adjustments, and benchmark data. Review weekly at the operational level and monthly for strategic alignment. Use control groups where possible to measure the causal impact of promotions or assortments.