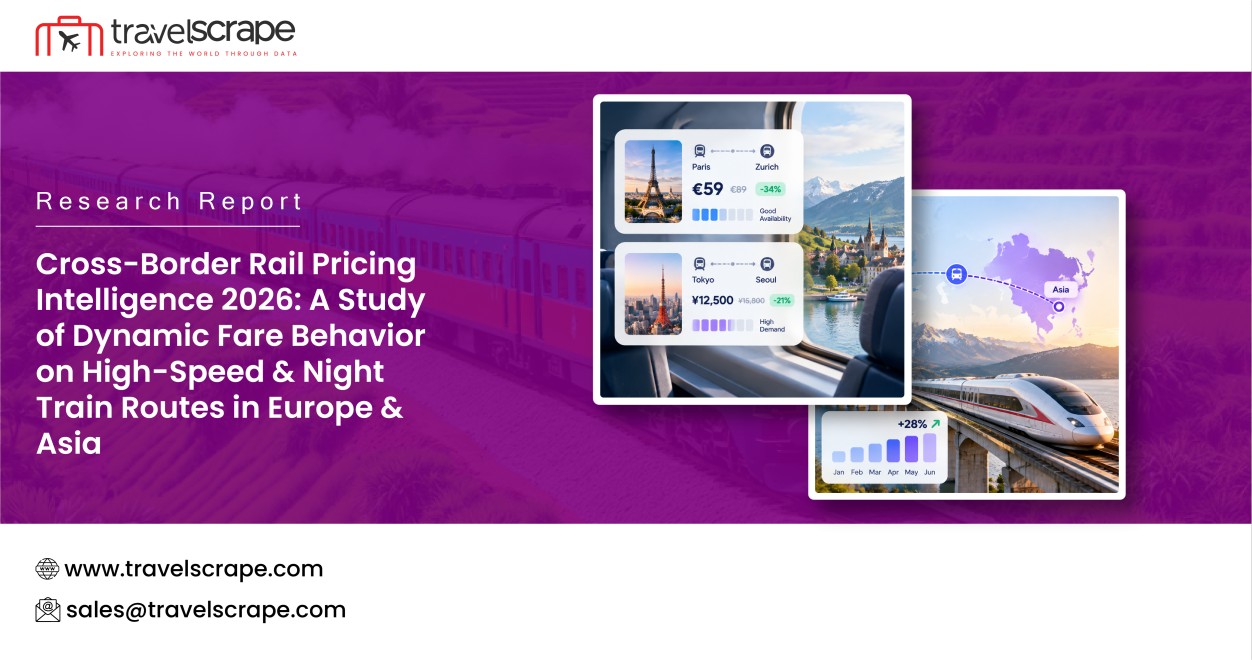
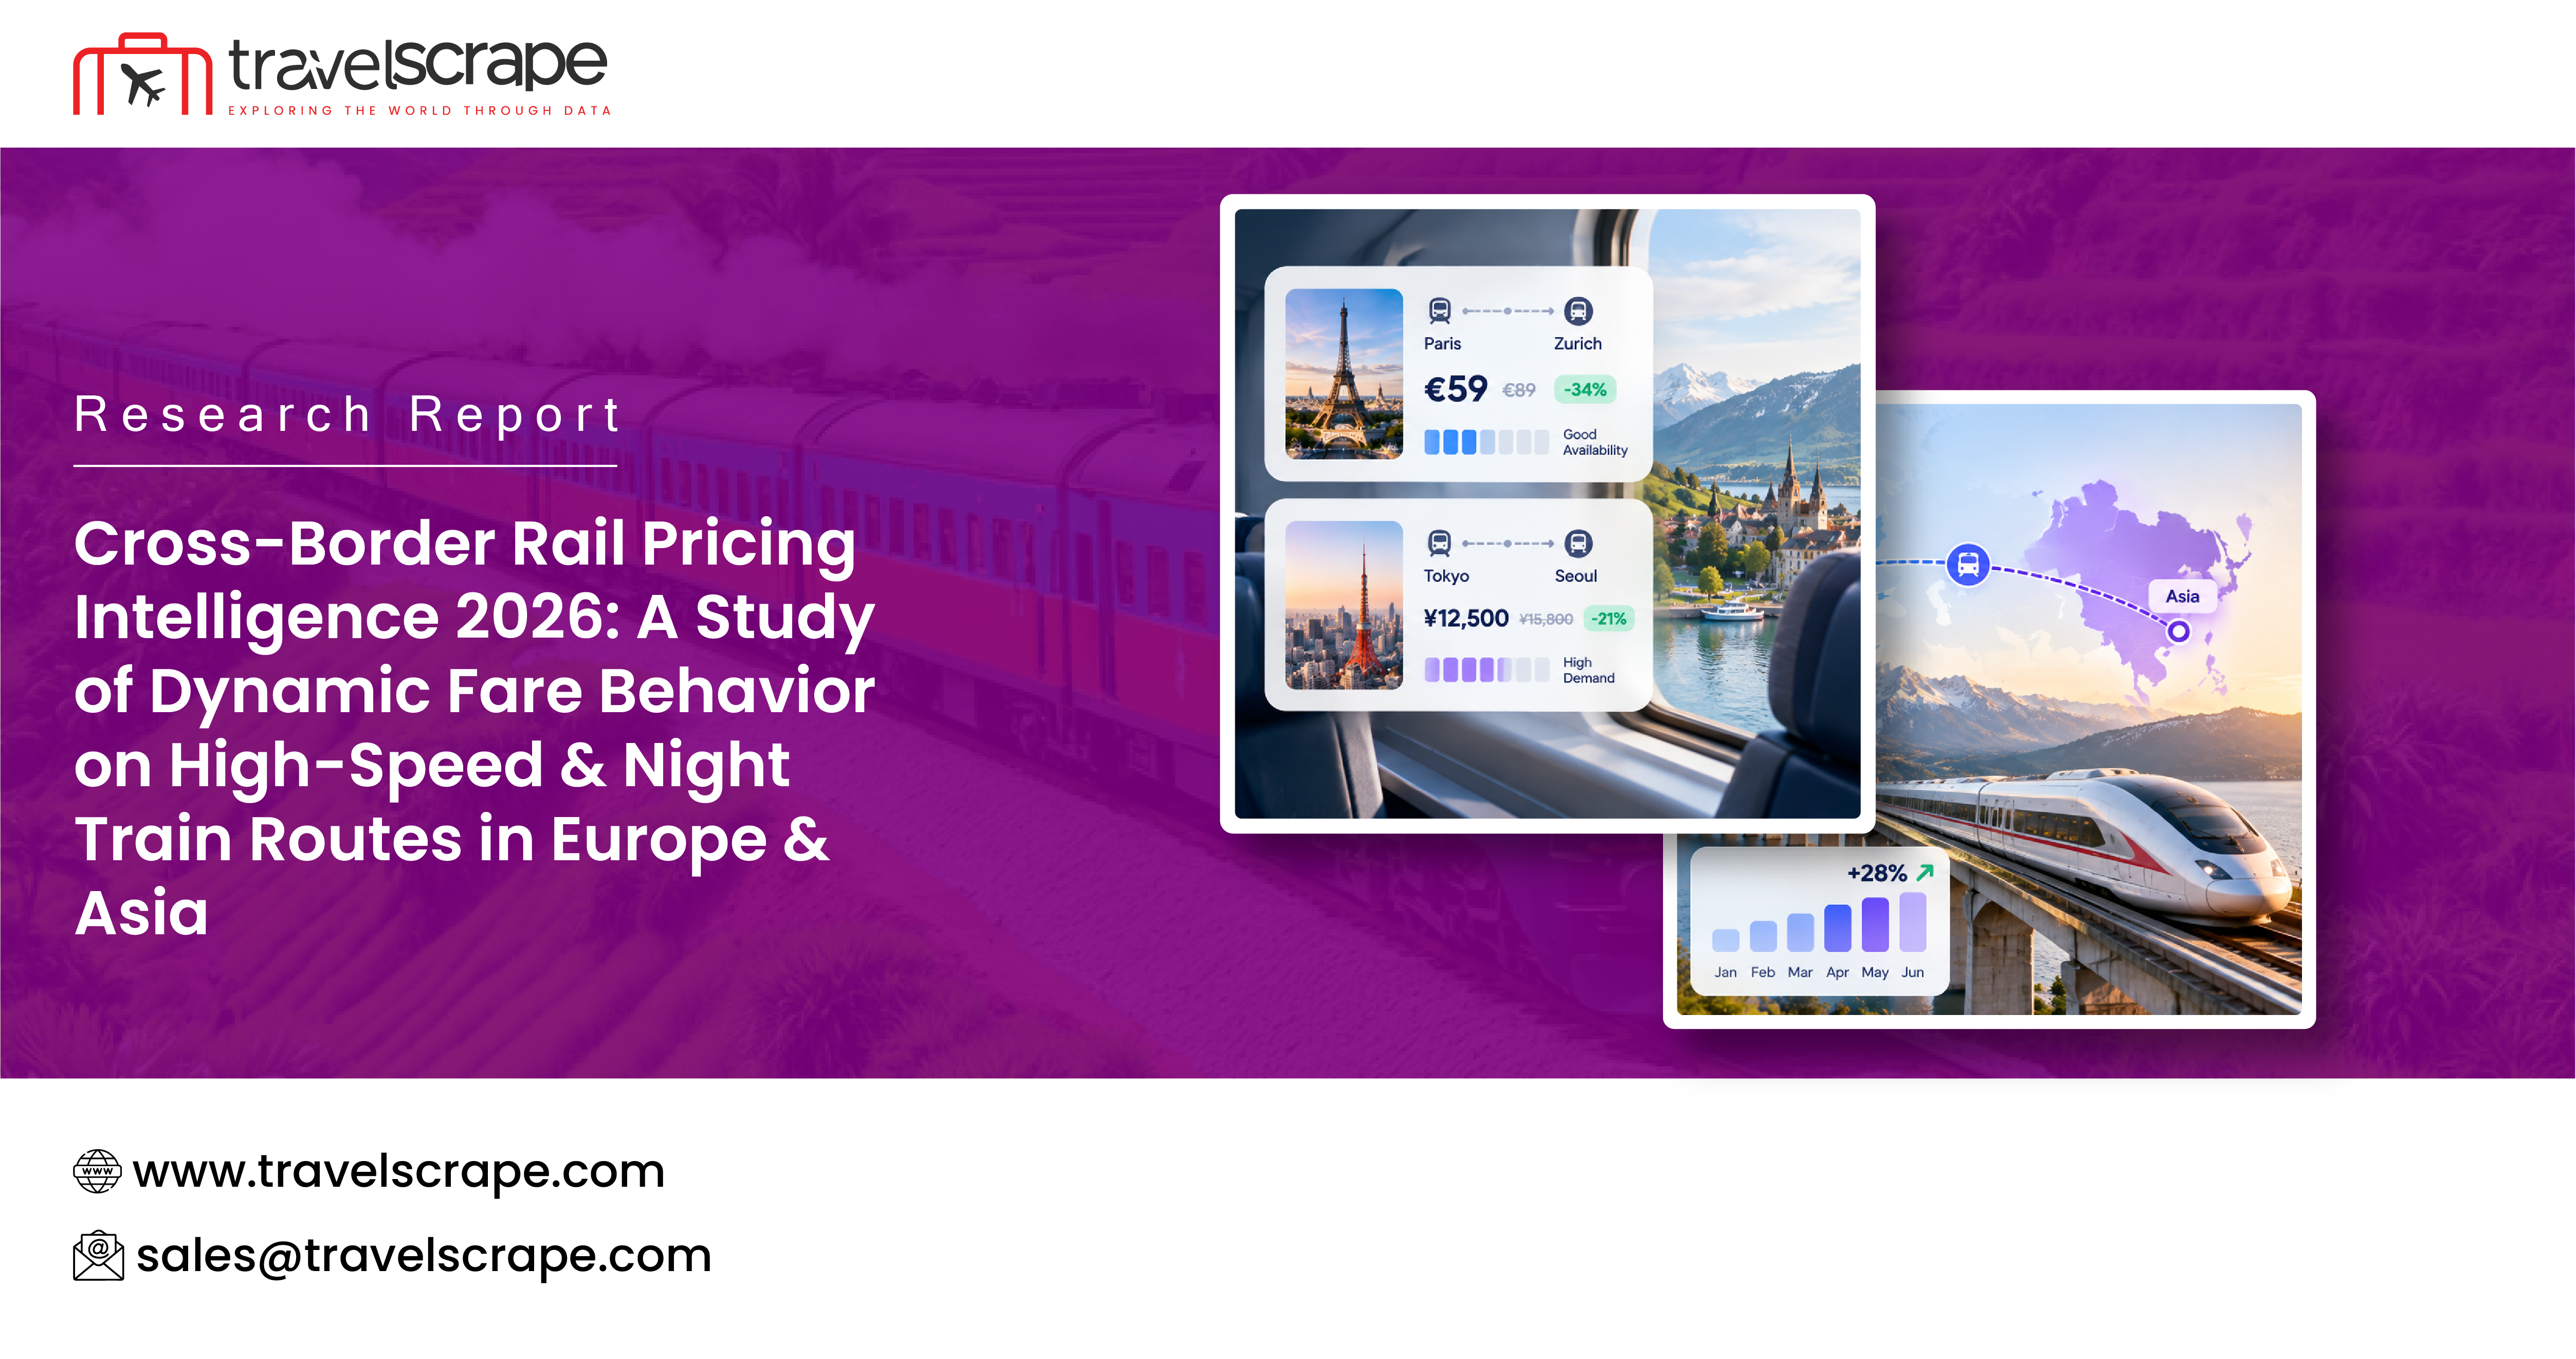
Cross-Border Rail Pricing Intelligence 2026
-

- Published Updated
- 78 views
Introduction
Rail pricing is rapidly evolving from a relatively predictable distance-based system into a sophisticated demand-, capacity-, timing-, and market-sensitive environment. In 2026, this transformation is particularly visible across Europe and Asia, where high-speed and overnight rail networks increasingly compete not only with airlines and coaches but also with one another for price-sensitive international passengers. Cross-Border Rail Pricing Intelligence 2026 therefore represents a strategic capability: continuously observing fares, seat availability, booking windows, journey characteristics and competitive movements to understand how international rail prices behave.
The commercial foundation of this intelligence is Train Data Scraping, which enables structured collection of publicly displayed journey, fare, timetable and availability information. Properly designed data collection can turn fragmented booking information into a longitudinal pricing dataset, although operators' terms, robots policies, authentication requirements and applicable laws must always be respected.
The research opportunity is especially strong because cross-border high-speed rail fare data extraction reveals price movements that cannot be understood through static timetable data alone. Eurostar, for example, explicitly promotes advance booking as a way to obtain lower fares, while its 2026 published examples range from €29 on selected Paris–Brussels services to €44 from London to several major destinations, subject to availability. SNCF also uses defined sales-opening windows, with some international services becoming available around four to six months before departure.
Asia presents a contrasting pricing architecture. China's regulatory framework allows high-speed operators to establish published fares while applying discounts according to market competition, passenger-flow patterns and demand characteristics. Recent research likewise finds significant differences between European yield-management-style HSR pricing and more distance- and train-type-oriented structures historically common in China, Japan and South Korea.
The result is a complex market in which price is no longer merely a function of kilometres travelled. It can represent a continuously changing estimate of demand, remaining inventory, departure proximity, service quality, competitive pressure and passenger willingness to pay.
Research Framework and Data Architecture
A robust dynamic night train fare dataset should capture considerably more than the advertised ticket price. Each observation should ideally contain route, operator, train number, departure date, departure time, booking timestamp, cabin or seat class, fare family, refundable status, seat availability, currency, taxes, journey duration and connection information.
For night trains, inventory should be separated into seating, couchette and sleeper categories. A €45 seat and a €110 sleeper are not simply different prices; they represent different products with different capacity constraints, privacy levels and demand profiles. The dataset should therefore treat fare changes at product level rather than assuming a single train has one price.
A useful analytical architecture combines four layers:
Collection layer: scheduled observations of operator and distributor booking interfaces.
Normalization layer: currency conversion, route standardization, fare-family mapping and timestamp normalization.
Analytics layer: price-change detection, booking-window analysis, elasticity estimation and competitor comparison.
Alerting layer: automated notifications when prices cross predefined thresholds or inventory deteriorates rapidly.
This creates the foundation for Dynamic Pricing Intelligence, allowing analysts to distinguish genuine demand-driven price changes from simple fare-class exhaustion.
Illustrative cross-border fare-monitoring dataset
The figures below are a research-model dataset for demonstrating analytical structure; they are not presented as live quotations for the named services.
| Region | Route | Service Type | Distance km | Booking Window Days | Lowest Fare € | Median Fare € | Peak Fare € | Fare Spread % | Seats Available at T-30 | Seats Available at T-3 |
|---|---|---|---|---|---|---|---|---|---|---|
| Europe | London–Paris | High-speed | 344 | 180 | 44 | 91 | 186 | 323 | 142 | 19 |
| Europe | Paris–Brussels | High-speed | 312 | 180 | 29 | 58 | 121 | 317 | 188 | 27 |
| Europe | Paris–Amsterdam | High-speed | 546 | 180 | 35 | 79 | 164 | 369 | 126 | 14 |
| Europe | Paris–Frankfurt | High-speed | 575 | 180 | 49 | 94 | 179 | 265 | 111 | 12 |
| Europe | Vienna–Munich | High-speed | 435 | 120 | 39 | 71 | 142 | 264 | 97 | 16 |
| Europe | Paris–Vienna | Night | 1,050 | 180 | 49 | 104 | 229 | 367 | 74 | 8 |
| Europe | Berlin–Prague | Night | 350 | 120 | 39 | 76 | 151 | 287 | 61 | 9 |
| Europe | Zürich–Vienna | Night | 750 | 180 | 59 | 128 | 274 | 364 | 58 | 6 |
| Asia | Beijing–Shanghai | High-speed | 1,318 | 120 | 62 | 91 | 138 | 123 | 520 | 83 |
| Asia | Tokyo–Osaka | High-speed | 515 | 90 | 72 | 104 | 153 | 113 | 340 | 51 |
| Asia | Seoul–Busan | High-speed | 325 | 60 | 38 | 55 | 79 | 108 | 410 | 72 |
| Asia | Shanghai–Hangzhou | High-speed | 159 | 30 | 11 | 18 | 31 | 182 | 690 | 141 |
| Asia | Beijing–Xi'an | High-speed | 1,216 | 90 | 58 | 86 | 131 | 126 | 385 | 64 |
| Asia | Tokyo–Hakata | High-speed | 1,174 | 90 | 112 | 157 | 221 | 97 | 270 | 31 |
| Asia | Bangkok–Chiang Mai | Night | 751 | 180 | 25 | 47 | 94 | 276 | 82 | 11 |
| Asia | Kuala Lumpur–Bangkok | Night | 1,150 | 90 | 34 | 63 | 119 | 250 | 49 | 7 |
The table illustrates an important pattern: the method to Scrape cross-border rail pricing across Europe & Asia should not mean collecting price snapshots at arbitrary intervals. The booking timestamp itself is an analytical variable. A fare of €50 seven months before departure has a completely different meaning from €50 three days before departure.
High-Speed Rail: The Economics of Fare Movement
European high-speed rail generally demonstrates stronger yield-management characteristics. Research has identified substantial price variation within the same origin-destination market based on purchase timing, departure period, vehicle type and other service characteristics. This resembles airline revenue management: inexpensive inventory is released early, while higher-priced inventory becomes increasingly important as departure approaches and lower fare buckets disappear.
However, the European market is not uniformly dynamic. Different operators and routes have different booking horizons, fare families and restrictions. SNCF's sales-opening rules, for example, vary by service and market. Cross-border journeys add another layer because two or more operators may have separate inventory systems and commercial rules.
Asia provides a valuable comparison. China's policy permits actual fares to respond to market conditions and demand patterns, while South Korea's 2026 railway developments demonstrate the importance of capacity and network integration. In April 2026, South Korea announced connected KTX/SRT operations intended to expand available seats, with a 10% promotional fare reduction associated with the trial. By August, the government and KORAIL were also emphasizing integrated digital booking and broader mobility services through KORAIL+.
This means that international rail fare analytics should incorporate operational events. A price increase may indicate rising demand, while a price decrease may reflect additional capacity, a promotion, an operator intervention or competitive pressure.
Night Trains: A Different Dynamic Pricing Problem
Night trains require a fundamentally different analytical approach because inventory is compartmentalized. A train may have 300 physical passenger spaces but only a small number of premium private sleeper compartments. Consequently, the disappearance of ten sleeper units can have a much greater pricing impact than the disappearance of ten ordinary seats.
The dynamic night train fare dataset should therefore calculate inventory pressure separately for each accommodation type. A useful metric is:
Inventory Pressure = 1 − Remaining Units / Initial Units
A second metric can track the price acceleration:
Fare Velocity = Percentage Fare Change / Number of Days Elapsed
Together, these indicators can identify situations where a sleeper fare rises rapidly because premium inventory is disappearing.
Night trains also exhibit stronger calendar effects. Friday and Sunday departures, holiday periods, summer tourism, major festivals and school breaks can generate sharp demand concentration. A route that appears inexpensive on Tuesday may become dramatically more expensive on Friday even when the train distance and operating cost remain almost unchanged.
Illustrative dynamic-pricing behavior by route segment
| Route Segment | Region | Product | T-60 Fare € | T-30 Fare € | T-14 Fare € | T-7 Fare € | T-1 Fare € | Fare Increase T-60→T-1 % | Inventory T-60 % | Inventory T-1 % | Peak Demand Index |
|---|---|---|---|---|---|---|---|---|---|---|---|
| London–Paris | Europe | Standard | 44 | 57 | 74 | 103 | 151 | 243 | 82 | 11 | 1.42 |
| Paris–Brussels | Europe | Standard | 29 | 42 | 53 | 71 | 105 | 262 | 88 | 14 | 1.36 |
| Paris–Amsterdam | Europe | Standard | 35 | 51 | 69 | 96 | 142 | 306 | 76 | 9 | 1.51 |
| Paris–Vienna | Europe | Sleeper | 89 | 112 | 141 | 176 | 231 | 160 | 68 | 7 | 1.63 |
| Zürich–Vienna | Europe | Sleeper | 96 | 128 | 164 | 201 | 274 | 185 | 63 | 5 | 1.71 |
| Berlin–Prague | Europe | Couchette | 48 | 62 | 78 | 101 | 137 | 185 | 71 | 8 | 1.55 |
| Beijing–Shanghai | Asia | Second Class | 62 | 69 | 76 | 82 | 91 | 47 | 91 | 21 | 1.28 |
| Beijing–Xi'an | Asia | Second Class | 58 | 67 | 78 | 91 | 118 | 103 | 84 | 16 | 1.47 |
| Tokyo–Osaka | Asia | Reserved Seat | 72 | 84 | 96 | 111 | 131 | 82 | 87 | 18 | 1.39 |
| Tokyo–Hakata | Asia | Reserved Seat | 112 | 128 | 149 | 177 | 211 | 88 | 79 | 13 | 1.52 |
| Seoul–Busan | Asia | Standard | 38 | 43 | 49 | 57 | 69 | 82 | 93 | 23 | 1.31 |
| Bangkok–Chiang Mai | Asia | Sleeper | 25 | 34 | 47 | 61 | 88 | 252 | 69 | 6 | 1.67 |
The figures demonstrate why Fare Fluctuation Alerts can become commercially valuable. Instead of simply notifying users that a fare has changed, an intelligent system can identify why it changed and estimate whether another increase is likely.
Building a Predictive Pricing Engine
The most commercially powerful application is Building a Dynamic Pricing Engine for a Bus Aggregator Using Real-Time Seat & Fare Scraping. The same architecture used to monitor rail can be adapted to intercity buses, enabling an aggregator to benchmark its own fares against trains.
A pricing engine could ingest rail and bus observations every 15–60 minutes, calculate relative price positioning, estimate remaining capacity and identify competitor movements. If a high-speed train suddenly becomes 35% more expensive while a bus remains unchanged, the aggregator may have an opportunity to adjust its fare upward without becoming uncompetitive.
Conversely, if a train operator releases additional capacity and reduces its effective fare, the bus operator can receive an automated warning before losing price-sensitive passengers.
The engine should incorporate:
- departure time and day-of-week effects;
- booking lead time;
- remaining inventory;
- fare class;
- historical price trajectory;
- competitor price;
- journey duration;
- transfer count;
- holiday and event calendars;
- currency exchange rates;
- cancellation and refund conditions.
Machine-learning models can then estimate the probability of a fare increase within the next 6, 12 or 24 hours. Recent HSR pricing research demonstrates the potential of demand-responsive pricing models: one 2026 study using Beijing–Shanghai data reported a simulated 33.38% revenue improvement versus fixed pricing while also redistributing passengers between peak and off-peak services.
Europe vs. Asia: Strategic Differences
The most important conclusion from Europe & Asia dynamic train fare behavior analysis is that there is no universal pricing formula.
Europe tends to exhibit stronger advance-purchase and fare-bucket behavior, particularly in competitive international high-speed markets. Asia contains a broader mixture of regulated, distance-oriented and market-responsive models. Japan's Shinkansen, China's high-speed network and South Korea's KTX system therefore require different normalization methodologies.
For analysts undertaking Europe & Asia high-speed train price monitoring, a common currency alone is insufficient. Prices must be adjusted for distance, journey duration, class, service quality, flexibility and inventory.
Cross-border integration is another major issue. The European Commission noted in May 2026 that comparing and booking multi-operator cross-border rail journeys remains difficult because fragmented booking systems can make journey planning and ticket combination complicated. This fragmentation is precisely why structured pricing intelligence has strategic value.
Conclusion
The 2026 rail market is moving toward a data-rich pricing environment in which fares provide signals about demand, capacity, competition and passenger behavior. High-speed routes increasingly resemble airline-style yield-management markets in some European corridors, while Asian systems offer a more diverse combination of market-responsive and structured pricing approaches.
For travel platforms, bus aggregators, mobility marketplaces and transport analysts, the winning strategy is not simply to collect today's cheapest fare. It is to construct a historical price-and-inventory intelligence layer capable of explaining when, why and how quickly fares move.
The combination of structured scraping, normalized international rail data, inventory monitoring, predictive modelling and automated Booking Trend Insights can transform millions of individual fare observations into actionable commercial intelligence. The ultimate objective is a continuously learning system that detects price acceleration, forecasts likely fare movements, identifies competitive gaps and helps operators position products before the market moves.
In that sense, cross-border rail pricing is becoming less of a timetable problem and more of a real-time intelligence problem. The organizations capable of systematically observing the market will have a significant advantage in pricing decisions, customer acquisition, revenue optimization and multimodal transport competition.
Ready to elevate your travel business with cutting-edge data insights? Scrape Aggregated Flight Fares to identify competitive rates and optimize your revenue strategies efficiently. Discover emerging opportunities with tools to Extract Travel Website Data, leveraging comprehensive data to forecast market shifts and enhance your service offerings. Real-Time Travel App Data Scraping Services helps stay ahead of competitors, gaining instant insights into bookings, promotions, and customer behavior across multiple platforms. Get in touch with Travel Scrape today to explore how our end-to-end data solutions can uncover new revenue streams, enhance your offerings, and strengthen your competitive edge in the travel market.
#CrossBorderRailPricingIntelligence2026#CrossBorderHighSpeedRailFareDataExtraction#DynamicNightTrainFareDataset#ScrapeCrossBorderRailPricingAcrossEuropeAndAsia#InternationalRailFareAnalytics#EuropeAndAsiaDynamicTrainFareBehaviorAnalysis#EuropeAndAsiaHighSpeedTrainPriceMonitoring