US Car Rental Data Scraping: Daily Rate Trends by Agency
-

- Published Updated
- 3,326 views
Executive Summary
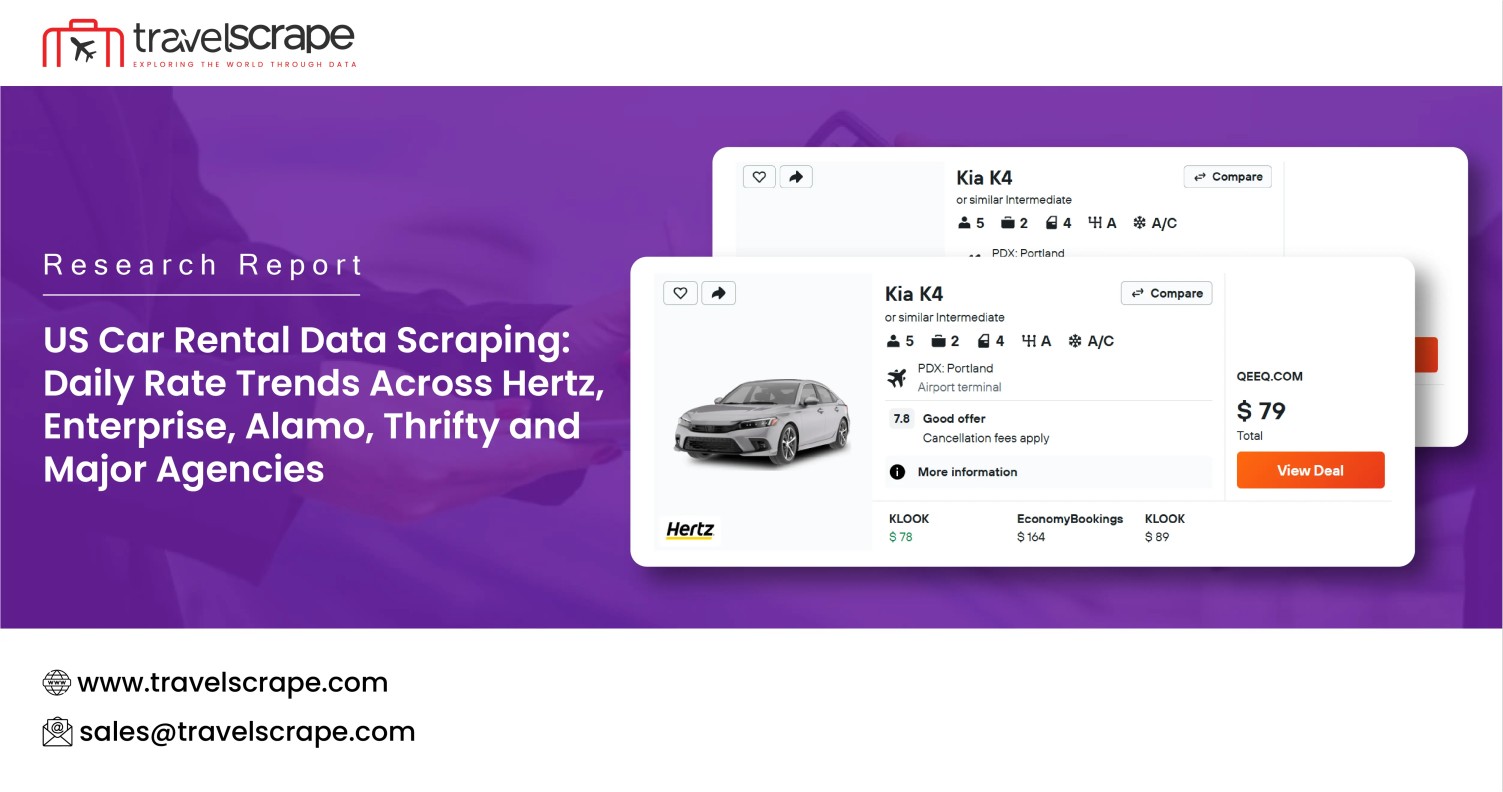
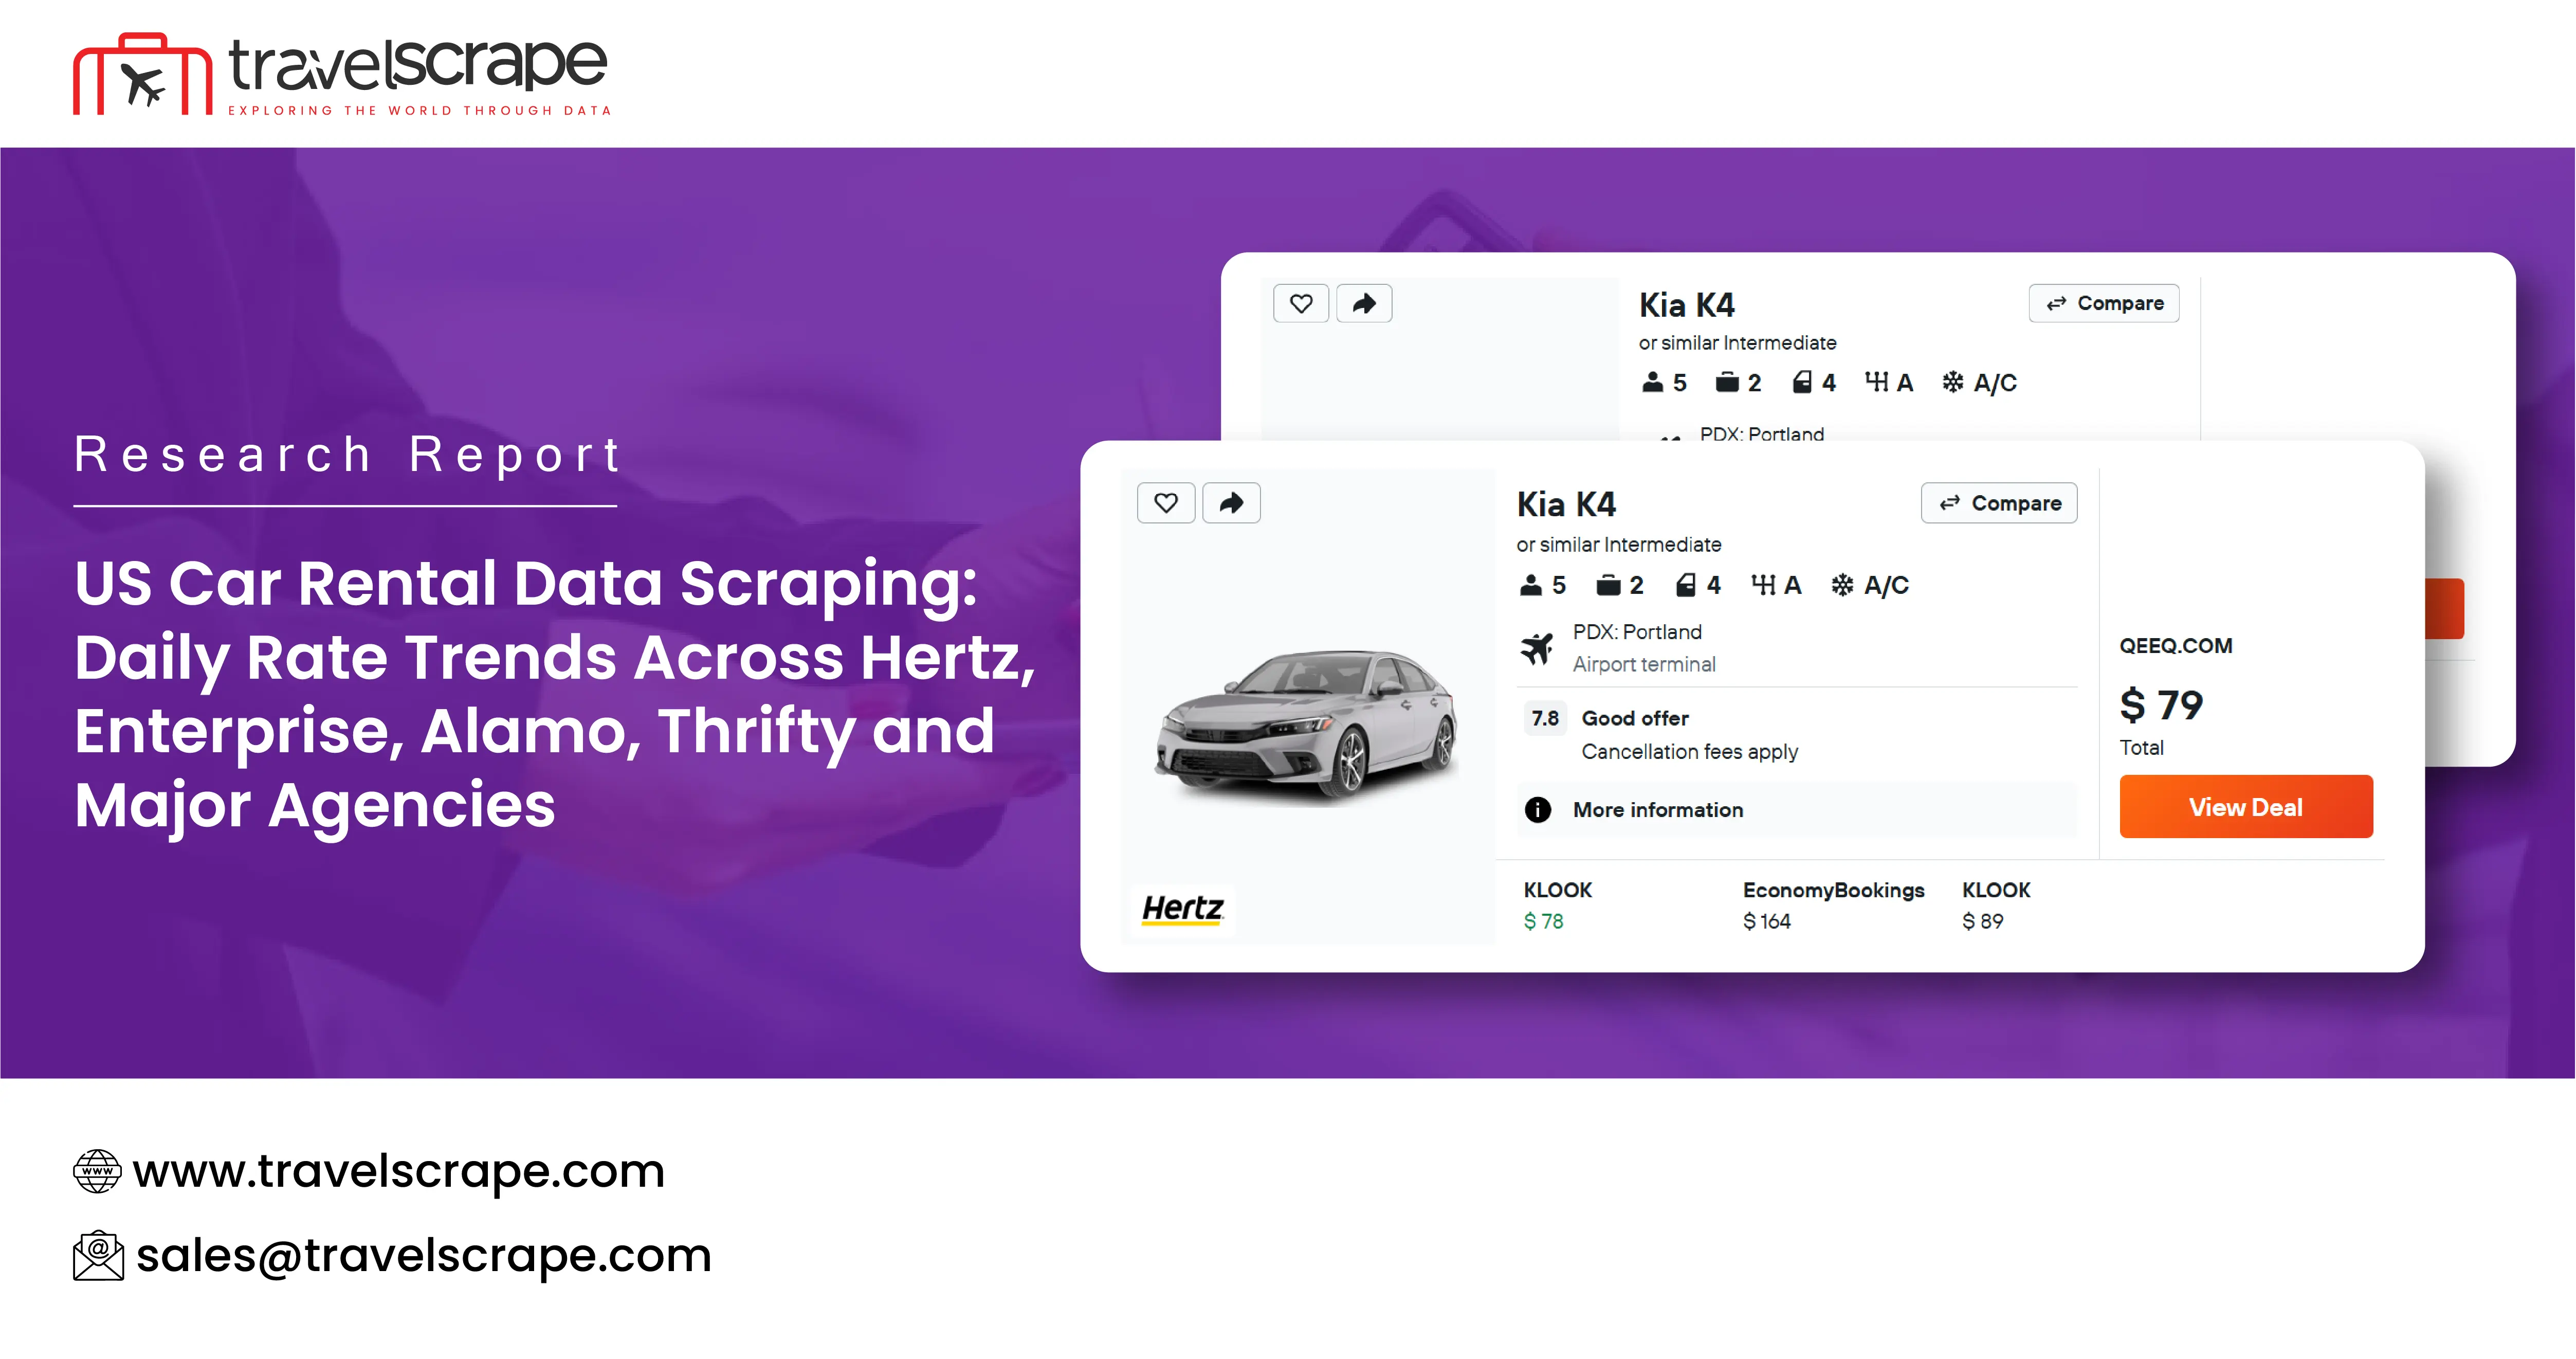
Car rental rates in the United States move daily and vary widely across agencies, locations, and car classes—yet most teams still plan against stale, single-agency snapshots. This report from Travel Data Scrape examines daily rate trends across major US rental agencies, including Hertz, Enterprise, Alamo, and Thrifty, to show how much rates shift over time and how differently agencies price the same rental. It is built on US car rental pricing data collected daily across agencies and tied to exact rental parameters, and it demonstrates the kind of competitive and market intelligence a cross-agency, all-in pricing feed makes possible.
The figures throughout are representative sample data drawn from the structure of Travel Data Scrape's dataset, included to illustrate the analysis the data supports. They are not audited market claims about any named agency; published reporting should draw on the live dataset. What the sample makes clear is consistent with what daily collection repeatedly shows: the lowest headline rate is frequently not the lowest true cost, cross-agency gaps are large and shifting, and demand-driven spikes reward anyone watching the market daily.
Methodology and Data Source
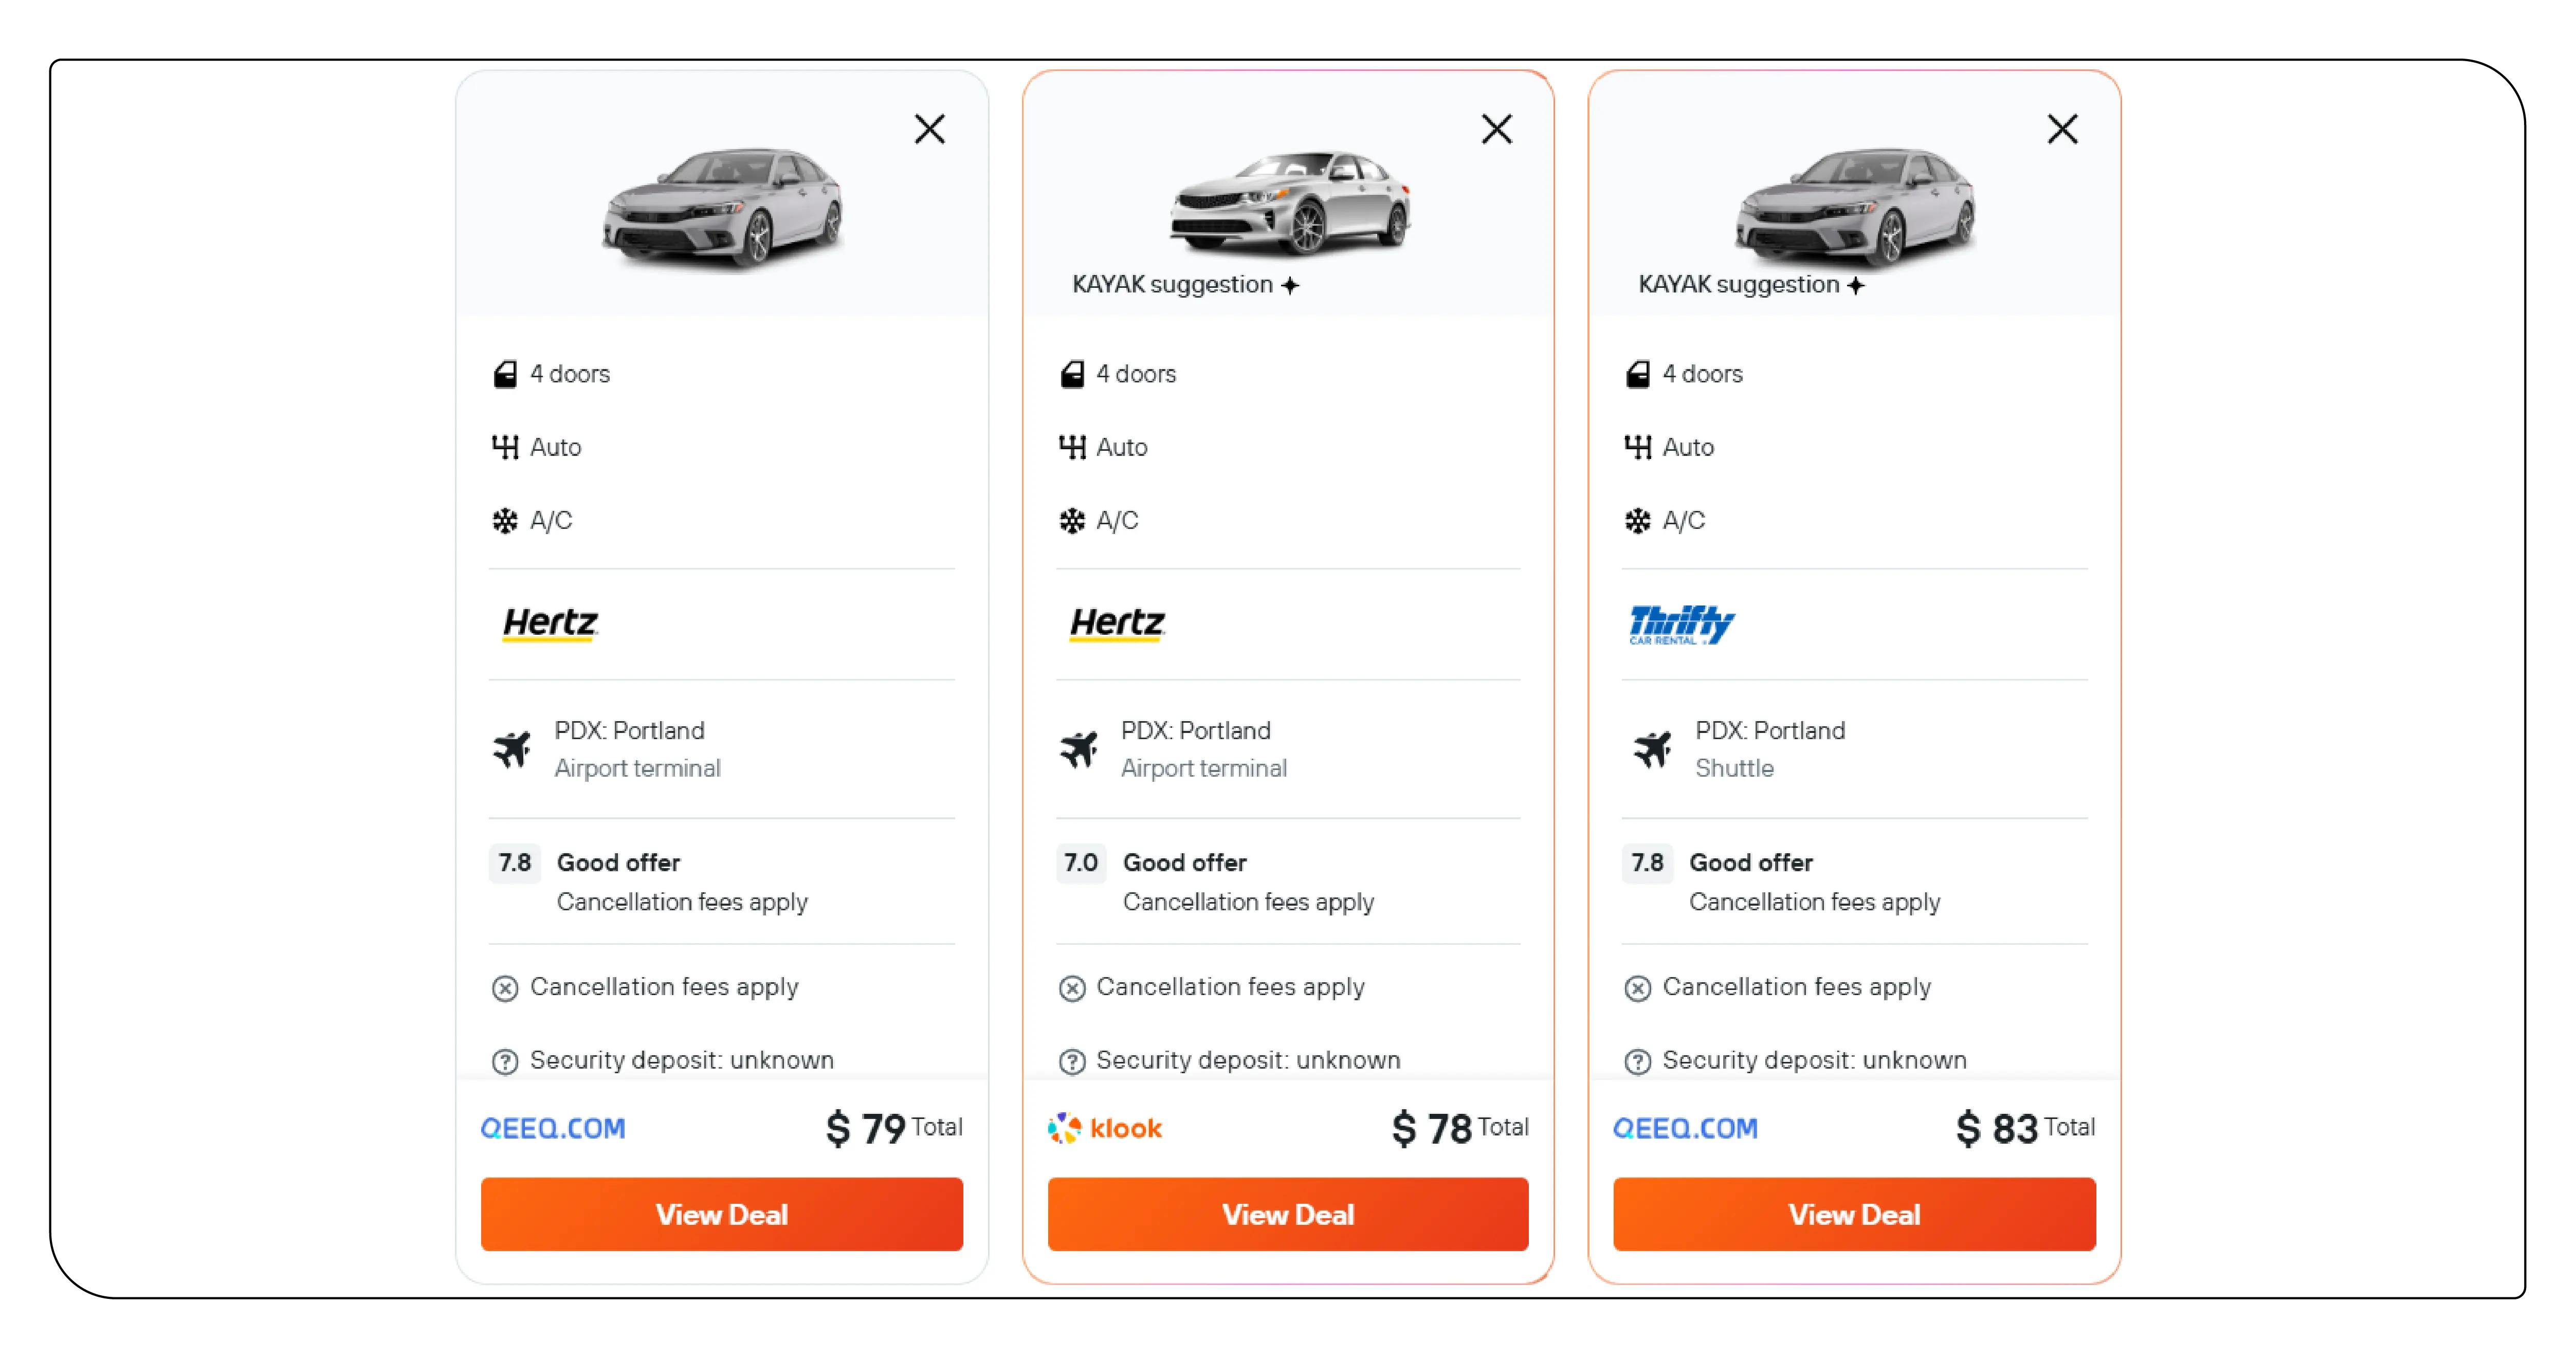
The analysis behind this report rests on daily car rental pricing data collected across major US agencies. For each observation, the dataset captures the full rental identity—pickup and drop-off location, pickup and drop-off dates and times, and car class—paired with the agency and the all-in commercial detail: base daily rate, total price for the rental window, mileage terms, and insurance or protection options. Prices are captured as all-in totals rather than headline daily rates, because mileage caps and bundled add-ons can change the true cost substantially.
Collection runs on a daily cadence, with tighter refreshes around high-demand periods, so the data reflects how rates actually move rather than a single frozen snapshot. Locations distinguish airport from downtown branches of the same agency, since these are distinct products at distinct prices. All figures in this report are illustrative samples that mirror this structure; they exist to show the shape of the data and the analysis it enables, and any figure intended for publication should be regenerated from the current live dataset.
Key Findings
Across the sampled routes, classes, and agencies, four patterns stand out consistently. First, daily rates for the same rental commonly move by double-digit percentages over a two-week window, driven by fleet availability and demand. Second, the spread between the cheapest and most expensive agency for an identical rental is often wide—frequently 15% to 30%—and it shifts from day to day rather than holding a fixed ranking. Third, the lowest headline daily rate is regularly not the lowest all-in cost once mileage caps and mandatory add-ons are included. Fourth, demand-driven spikes around holidays, weekends, and major local events move rates sharply and shorten the window in which a good rate exists.
Each of these patterns is invisible to a weekly, single-agency, or headline-rate view, and each is exactly what daily cross-agency collection surfaces.
Daily Rate Trends by Agency
The table below shows representative average daily rates for an intermediate SUV at a major airport over a sample two-week window, illustrating how agencies move independently rather than in lockstep. Figures are illustrative samples in USD.
| Agency | Week 1 Avg | Week 2 Avg | Change | Mileage |
|---|---|---|---|---|
| Hertz | 58.40 | 52.10 | -10.8% | Unlimited |
| Enterprise | 54.90 | 55.60 | +1.3% | Unlimited |
| Alamo | 51.20 | 47.80 | -6.6% | Unlimited |
| Thrifty | 47.50 | 49.90 | +5.1% | 150 mi/day |
The pattern the sample illustrates is the point: one agency softens while another firms, and the cheapest option changes across the window. A planner who checked once at the start of Week 1 would have a materially wrong picture by Week 2—and a competitor watching daily would not.
Rate Variation by Car Class
Rates diverge sharply by car class, and the gaps themselves carry signal about where demand and supply are tight. The table below shows representative all-in totals for a four-day airport rental across classes, illustrative samples in USD.
| Car Class | Low Agency Total | High Agency Total | Spread |
|---|---|---|---|
| Economy | 176.00 | 214.00 | 21.6% |
| Intermediate SUV | 214.00 | 262.00 | 22.4% |
| Full-Size | 232.00 | 271.00 | 16.8% |
| Premium/Luxury | 388.00 | 505.00 | 30.2% |
Premium and luxury classes typically show the widest cross-agency spreads in the sample, reflecting thinner supply and more variable pricing—precisely where a comparison tool or a revenue team gains the most from complete coverage.
The Headline-Rate Trap: All-In Cost Matters
One of the clearest lessons in the data is that the lowest advertised daily rate is often not the cheapest rental. A low headline rate paired with a mileage cap and mandatory add-ons can exceed a slightly higher rate that includes unlimited mileage. The sample JSON below shows two agencies whose ranking flips once mileage is considered.
{
 "pickup_location": "LAX Airport",
 "car_class": "Intermediate SUV",
 "rental_days": 4,
 "currency": "USD",
 "agencies": [
 { "agency": "Agency A", "daily_rate": 47.50, "total_all_in": 214.00, "mileage": "capped_150mi_day" },
 { "agency": "Agency B", "daily_rate": 52.10, "total_all_in": 208.40, "mileage": "unlimited" }
 ],
 "lowest_headline": "Agency A",
 "lowest_all_in_for_long_trip": "Agency B",
 "note": "capped mileage adds overage cost on a road trip"
}
For any traveler driving beyond the cap, Agency B is the better deal despite the higher sticker rate. This is why all-in, mileage-aware pricing data matters, and why headline-only comparisons mislead.
Seasonality and Demand-Driven Spikes
Rental rates follow demand, and demand has a calendar. Holidays, long weekends, summer travel, and major local events—conventions, festivals, sporting events—drive rates at nearby locations up sharply and shorten the window in which a good rate exists, because fleet supply is finite. The representative series below illustrates how a single route's average rate can climb into an event weekend and release afterward.
{
 "location": "Sample Airport",
 "car_class": "Full-Size",
 "currency": "USD",
 "daily_avg_series": [
 { "date": "2026-10-01", "avg_total": 232 },
 { "date": "2026-10-08", "avg_total": 268 },
 { "date": "2026-10-11", "avg_total": 341 },
 { "date": "2026-10-15", "avg_total": 245 }
 ],
 "signal": "event_weekend_spike"
}
Only daily collection makes this trajectory visible; an occasional snapshot captures one point and misses the curve. For savings tools, this supports "book now, rates are climbing" guidance; for revenue teams, it reveals how competitors price into a known spike.
Airport vs Downtown: Location Premiums
Location is not a detail in car rental pricing—it is a pricing dimension in its own right. Airport branches typically carry higher rates than nearby downtown or neighborhood locations of the same agency, reflecting airport concession fees and captive demand from arriving travelers. Conflating the two produces misleading comparisons, so precise location matching is essential. The table below shows representative all-in totals for the same four-day intermediate rental at airport versus downtown branches, illustrative samples in USD.
| Agency | Airport Total | Downtown Total | Airport Premium |
|---|---|---|---|
| Hertz | 231.60 | 198.40 | +16.7% |
| Enterprise | 224.00 | 205.20 | +9.2% |
| Alamo | 214.80 | 189.60 | +13.3% |
The premium varies by agency, and the sample shows it is large enough to change which option is cheapest overall once a traveler is willing to collect from a downtown branch. For savings tools this is an actionable recommendation; for revenue teams it is a lever competitors are already pulling. Capturing location-level detail—rather than a single city-level rate—is what makes this visible, and it is a standing part of how Travel Data Scrape structures its US car rental pricing data.
Cross-Agency Positioning and One-Way Rentals
Because agencies move independently, cross-agency positioning is itself intelligence. On any given day, the cheapest agency for a class and location may be the most expensive a week later, so a fixed assumption about "the cheapest brand" is unreliable. One-way rentals add another dimension the sample repeatedly highlights: picking up in one city and dropping in another carries drop-off fees that vary sharply by agency and route, often making the same one-way trip far cheaper with one brand than another depending on which needs to reposition vehicles. Capturing one-way and round-trip pricing alike, tied to the exact location pair, is what makes these comparisons hold up at booking.
What the Data Means
Taken together, the patterns point to a simple conclusion: US car rental pricing is too volatile, too varied across agencies, and too obscured by all-in cost differences for anyone to plan against a static or single-source view. The teams that win—whether saving travelers money or defending margin as an agency—are the ones working from daily, cross-agency, all-in data rather than a headline rate checked last week. The value is not in any single number but in the movement and the comparison: which agency is cheapest today, how fast rates are climbing into a spike, and whether the lowest sticker is really the lowest cost.
There is also a compounding effect worth noting. Because each of these dimensions—daily movement, cross-agency spread, all-in cost, location premium, and one-way pricing—interacts with the others, the true best rental for a given traveler is rarely obvious from any single view. The cheapest agency on Tuesday may lose its edge by Friday; the lowest sticker may carry a mileage cap; the airport rate may exceed a downtown alternative. Only a dataset that captures all of these dimensions together, refreshed daily, can resolve them into a correct recommendation or an accurate competitive picture. That is precisely the gap between raw, one-off price checks and genuine, ongoing pricing intelligence, and it is exactly the gap this data is built to close.
Who Uses This Data
Several kinds of team turn daily US car rental pricing data into an advantage. Consumer savings and travel apps power rate alerts and honest, all-in comparisons that hold up at booking. Rental agencies and revenue teams monitor competitors' rates by class, location, and date to position their own pricing against a live market view. OTAs and aggregators benchmark their rental inventory to stay competitive. Corporate travel and expense platforms enforce policy and capture savings on ground transport. And market-research and analytics teams study rate trends, seasonality, and competitive dynamics across agencies and cities. In each case, the report above is not a one-time artifact but a repeatable capability, refreshed daily.
How Travel Data Scrape Delivers It
Travel Data Scrape supplies the foundation this report is built on: US car rental pricing data collected daily across the major agencies, including Hertz, Enterprise, Alamo, and Thrifty; all-in pricing that captures mileage, insurance options, taxes, and fees rather than a misleading headline rate; location-precise records that distinguish airport from downtown and capture one-way pricing; and clean, application-ready delivery via feed or API. The same discipline extends across the wider travel data—flights, hotels, cruises, and rides—so a product or research program can grow beyond rentals on one consistent foundation. Reports like this one can be produced continuously from the live dataset rather than assembled by hand.
Conclusion
US car rental rates move daily, vary widely across agencies, and hide their real cost behind mileage terms and add-ons—which makes a single headline rate one of the least reliable numbers in travel planning and pricing. Daily, cross-agency, all-in pricing data turns that volatility into a clear, comparable picture: which agency leads today, how rates are trending into demand, and where the true lowest cost actually sits. With Travel Data Scrape delivering that data across Hertz, Enterprise, Alamo, Thrifty, and the wider market, savings tools, revenue teams, and analysts can act on rates that are broad, precise, and current rather than stale and partial.
Ready to elevate your travel business with cutting-edge data insights? Scrape Aggregated Flight Fares to identify competitive rates and optimize your revenue strategies efficiently. Discover emerging opportunities with tools to Extract Travel Website Data, leveraging comprehensive data to forecast market shifts and enhance your service offerings. Real-Time Travel App Data Scraping Services helps stay ahead of competitors, gaining instant insights into bookings, promotions, and customer behavior across multiple platforms. Get in touch with Travel Scrape today to explore how our end-to-end data solutions can uncover new revenue streams, enhance your offerings, and strengthen your competitive edge in the travel market.