How an Intelligent Log Monitoring System Transforms DevOps Reliability
-
- March 15th, 2026
- 270 views
Modern DevOps teams require visibility that keeps pace with frequent releases and complex distributed systems. An intelligent log monitoring system surfaces actionable signals from noisy log streams so teams can detect incidents faster, reduce mean time to repair (MTTR), and focus on high-value remediation. This guide explains why an intelligent log monitoring system is essential for a resilient DevOps technologies stack and how to adopt one without adding operational debt.
- What it is: an intelligent log monitoring system applies structured logging, indexing, correlation, and automation (including anomaly detection) to produce actionable alerts.
- Core benefits: faster detection, prioritized alerts, compliance-ready retention, and better incident context for SRE and DevOps teams.
- Quick checklist: the LOGS Checklist—Label, Organize, Govern, Scale—helps implement without breaking pipelines.
Detected intent: Informational
intelligent log monitoring system: Core benefits for DevOps
An intelligent log monitoring system reduces noise while amplifying signals. Instead of treating logs as passive archives, intelligent monitoring platforms parse structured logs, correlate events with metrics and traces, and apply rule-based and statistical anomaly detection. The result is fewer false positives, prioritized incidents aligned to service-level objectives (SLOs), and clearer remediation context—who, where, why.
Key benefits include:
- Faster incident detection and reduced MTTR through automated correlation of logs, metrics, and traces (observability).
- Improved alert quality by prioritizing based on user impact, error rates, and traffic patterns.
- Regulatory readiness with searchable retention, tamper-evidence, and access controls for compliance audits.
- Operational efficiency through log analysis automation and adaptive sampling that lower storage and query costs.
How an intelligent log monitoring system fits into a DevOps stack
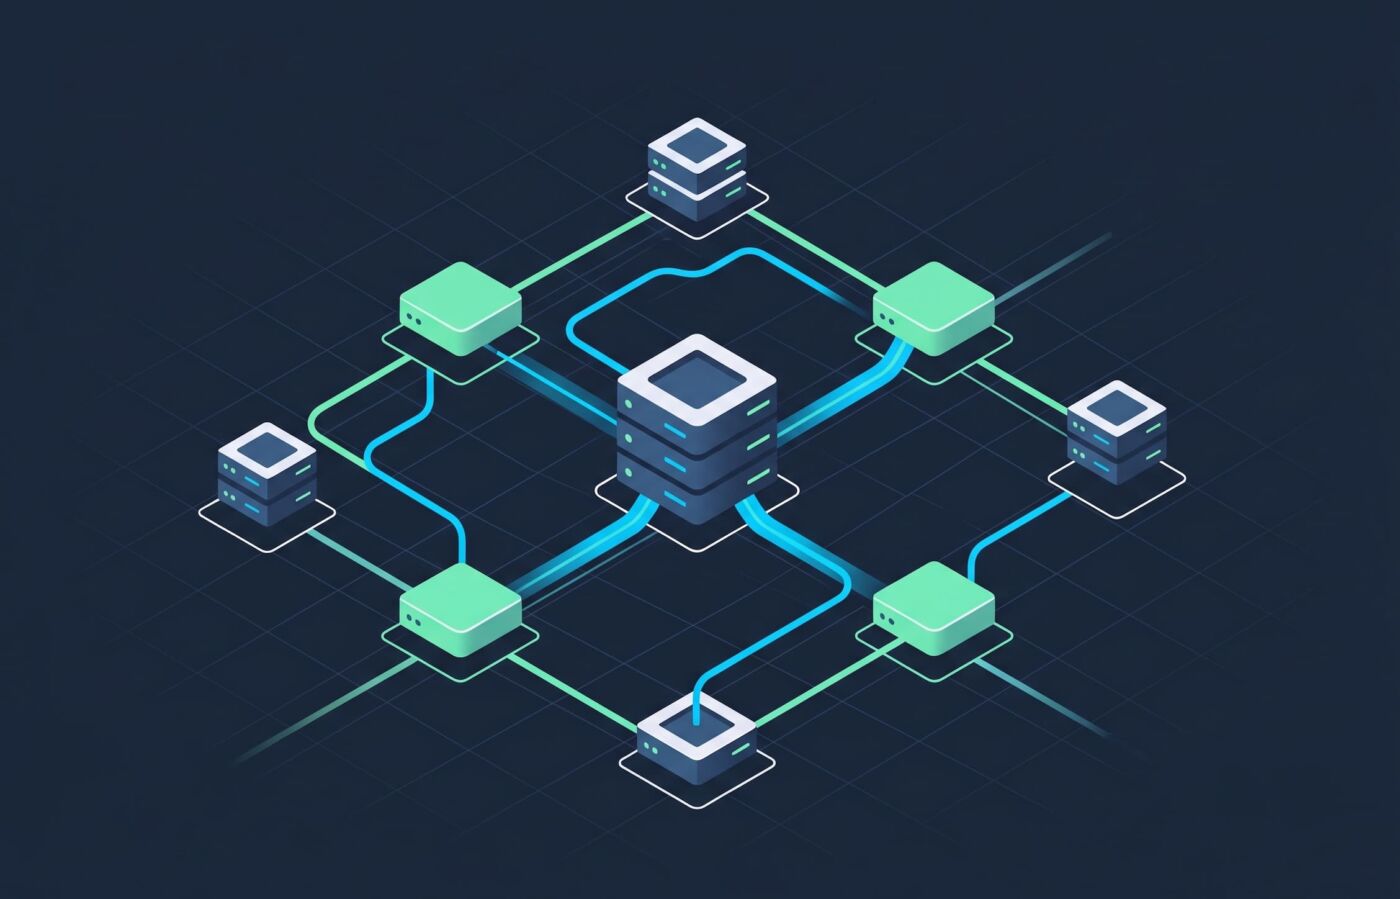
An intelligent system sits at the center of the telemetry pipeline. Logs flow from instrumented services and sidecars (structured JSON preferred) into an ingestion layer, then into indexing, correlation, and storage components. Intelligence comes from enrichment (adding metadata), correlation engines that link logs to traces and metrics, and ML or rule-based anomaly detectors that spot unusual patterns.
DevOps log management best practices
Follow these practical patterns when integrating logging with CI/CD and SRE workflows:
- Emit structured, schema-stable logs to simplify parsing and querying.
- Tag logs with deployment metadata (git commit, environment, service) so alerts map to releases.
- Define retention tiers: high-value indexed logs, and cheaper cold storage for long-term audit needs.
- Use sampling and aggregation for high-volume events to control costs without losing signal.
For specific secure-logging practices and examples, consult authoritative logging guidance such as the OWASP Logging Cheat Sheet for secure and privacy-aware logging strategies: OWASP Logging Cheat Sheet.
LOGS Checklist for adopting an intelligent log monitoring system
A named checklist accelerates adoption. The LOGS Checklist provides a compact sequence to follow:
- Label — Standardize fields (timestamp, service, environment, request_id, user_id) and adopt structured JSON logs so parsing and correlation work reliably.
- Organize — Route logs into tiers (hot indexed for recent incidents, warm for analytics, cold for compliance) and map indexes to services and teams.
- Govern — Apply retention policies, RBAC, and PII masking rules to meet compliance and security reviews (align with NIST guidance where relevant).
- Scale — Use adaptive sampling, aggregation, and cost-aware indexing; automate rollouts of new parsers and schemas as services evolve.
Real-world example: payment service incident
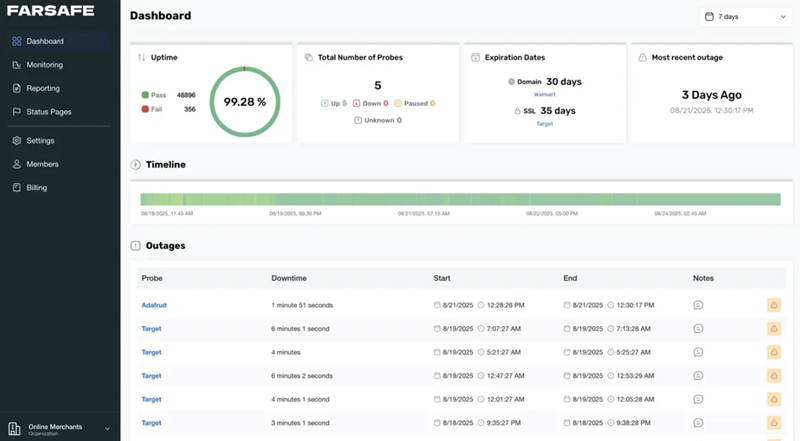
Scenario: An online payment processing service experienced a spike in failed transactions after a library update. An intelligent log monitoring system detected a rise in a specific error code correlated with a deployment tag and a drop in successful payment SLI. A prioritized alert routed to the on-call SRE included the failing endpoint, recent commit hash, and a link to the trace showing a timeout in the third-party gateway. The team rolled back the deploy and applied a retry policy, resolving the outage within the first 20 minutes—significantly faster than the previous average MTTR of several hours.
Practical tips (actionable)
- Instrument services with structured JSON logs and include a stable request_id to connect logs to traces and metrics.
- Define meaningful alert thresholds tied to SLOs; use automated incident severity scoring to reduce pager noise.
- Enable log analysis automation (parsing, enrichment, anomaly detection) but review auto-generated models weekly to guard against drift.
- Plan retention and index strategy before ingesting high volumes to avoid surprised billing—use tiered storage and sampling.
Trade-offs and common mistakes
Trade-offs:
- Cost vs. coverage: Indexing everything provides the most searchability but increases storage and query cost—sample or aggregate low-value logs.
- Noise vs. sensitivity: Highly sensitive anomaly detection catches subtle failures but can raise false positives; tune models to SLO impact.
- Centralized vs. federated logging: Centralization simplifies cross-service correlation but can create a single point of failure and data governance complexity.
Common mistakes:
- Logging only errors and missing contextual fields (user, request, deployment) which slows diagnosis.
- Over-alerting on low-impact logs; alerts should map to user impact and business risk.
- Ignoring privacy and compliance controls when shipping logs to third-party services.
Core cluster questions
- How does an intelligent log monitoring system differ from traditional log aggregation?
- What are the minimum structured logging fields required for effective correlation?
- How should retention and indexing strategy be chosen for cost control?
- When should anomaly detection be used versus rule-based alerting?
- How to integrate log-based alerts with SLO-driven alerting and incident response?
FAQ
What is an intelligent log monitoring system and when should a team adopt one?
An intelligent log monitoring system combines structured logging, enrichment, correlation with traces/metrics, and automation (such as anomaly detection and prioritization) to surface actionable incidents. Teams should adopt one when release velocity, distributed architectures, or compliance needs make manual log search infeasible and when reducing MTTR is a measurable goal.
How much does an intelligent log monitoring system typically cost?
Costs vary with ingestion volume, retention tiers, and query patterns. Budget planning should start with projected log volume, expected retention windows, and the percentage of logs requiring full indexing. Implement adaptive sampling and tiered storage to control costs.
Can logs replace metrics and tracing in observability?
No. Logs, metrics, and tracing serve different purposes. Metrics are best for high-level health indicators, traces show request flows and latencies, and logs provide the detailed context. An intelligent system links all three for fast root cause analysis.
How does an intelligent log monitoring system handle sensitive data?
Governance controls—masking, field redaction, and RBAC—are essential. Apply PII filtering at the ingestion point, keep audit trails for access, and align policies with internal compliance teams or standards bodies like NIST.
How can teams begin improving log quality quickly?
Start with a lightweight schema for structured logs, add request IDs, and enforce logging standards as part of CI checks. Apply the LOGS Checklist to iterate: Label, Organize, Govern, Scale.