AI Data Visualization for Financial Reporting: Practical Guide and Checklist
-

- March 29th, 2026
- 196 views


FREE SEO Topical Map Generator: Find Your Next Content Ideas
AI data visualization for financial reporting delivers faster insight from balance sheets, P&L statements, and portfolio positions by combining clean data pipelines with automated charting and natural-language summaries. This guide explains how to evaluate, design, and operate AI-driven visualizations that meet audit, governance, and investor-communication needs.
AI data visualization for financial reporting: benefits and setup
What this term covers
AI data visualization for financial reporting refers to tools and processes that use machine learning, natural-language generation, and rule-based automation to create charts, interactive dashboards, and written summaries from structured financial data. Typical outputs include monthly investor decks, executive dashboards, variance analyses, and compliance-ready schedules.
Key benefits
- Faster report generation: reduce manual chart creation and formatting.
- Consistency and repeatability: standardized visual templates and automations.
- Enhanced insight: anomaly detection and trend highlighting powered by models for time-series data.
- Scalability: automated updates for large portfolios or many entities.
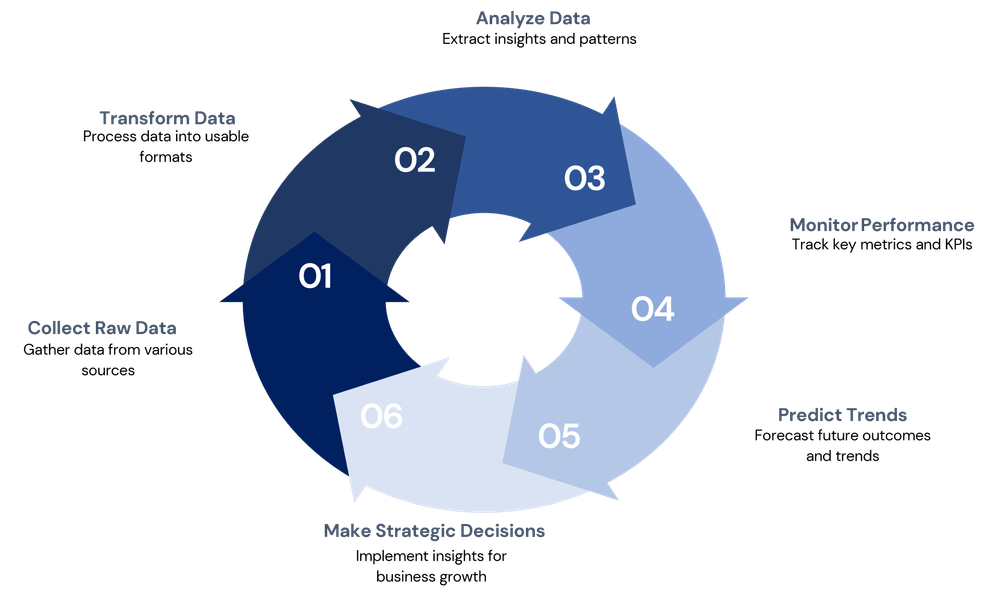
Practical workflow and the VISUAL checklist
Adopt a repeatable workflow that aligns data engineering, visualization design, and governance. The VISUAL framework below is a practical checklist to operationalize AI visualizations.
VISUAL framework (named checklist)
- V — Validate: schema checks, reconciliation with GL, and outlier detection.
- I — Integrate: centralize feeds (ETL into cloud warehouse), timestamp standardization, currency conversion rules.
- S — Select visuals: match chart types to questions (time-series for trends, waterfall for bridge analyses).
- U — UX & annotations: clear labels, data layer toggles, and automated annotations driven by detected events.
- A — Automate: scheduled refreshes, templated charts, and natural-language summaries for context.
- L — Log & audit: store generation metadata, input snapshot, and versioned artifacts for compliance.
Data sources, models, and governance
Common data sources
General ledger exports, custodial position feeds, market pricing APIs, transaction-level data, and investor account records. For regulatory or audit uses, ensure reconciliation to primary systems.
Modeling and AI components
Typical AI components include time-series anomaly detectors, clustering for segmentation, and NLG modules that generate narrative summaries of variance drivers. Machine-learning outputs should be accompanied by deterministic rules for deterministic calculations (ratios, accruals) to preserve auditability.
Regulatory and standards reference
Follow authoritative accounting guidance and disclosure requirements when producing external reports. See the Financial Accounting Standards Board for authoritative accounting standards and guidance if applicable: fasb.org.
Real-world example
Scenario: An investment firm needs a monthly investor report across 150 client portfolios. Data sources include custodial positions, trade blotters, and market prices. Implementing the VISUAL checklist: validate nightly feeds against custody reports, integrate into a cloud data warehouse, use automated chart templates for performance and attribution, and generate a one-page summary with NLG that highlights top contributors and risk exposures. Result: report creation time drops from three days to three hours, with consistent charts and a stored audit trail of inputs and outputs.
Practical tips for implementation
- Start with a single, high-impact report (e.g., monthly performance) and template it before scaling to more reports.
- Keep calculated fields deterministic and documented; use ML only for supplemental insights like anomaly flags or narrative summaries.
- Version control visual templates and store rendering metadata (timestamp, data snapshot ID, templates used) for audit and rollback.
- Design visuals for the primary audience: executives prefer one-page highlights, analysts need drilldowns and raw data export.
Trade-offs and common mistakes
Trade-offs
- Speed vs. auditability: full automation speeds delivery but requires stronger logging and reconciliation to satisfy auditors.
- Flexibility vs. consistency: highly customizable dashboards can confuse audiences; templates enforce clarity at the cost of some flexibility.
- Model complexity vs. explainability: advanced ML models may find subtle patterns but can be harder to explain to stakeholders and regulators.
Common mistakes
- Skipping reconciliation to source systems before publishing visuals.
- Using ML outputs as definitive without human review for unusual cases.
- Neglecting performance implications of real-time visualizations on large datasets.
Operational checklist before go-live
- Confirm data reconciliation and reconciliation schedules.
- Document chart definitions, axis scales, and aggregation windows.
- Run a sample audit: reproduce one published report from raw inputs end-to-end.
- Establish incident and change management processes for template changes.
Frequently asked questions
How does AI data visualization for financial reporting reduce manual effort?
Automation handles repetitive tasks: chart rendering, formatting, and routine reconciliations. NLG can auto-generate variance commentary, and anomaly detection highlights exceptions for human review, freeing analysts to focus on interpretation and decision-making.
What controls are needed to ensure auditability of automated visuals?
Maintain immutable data snapshots, log transformation steps, version visualization templates, and store metadata about rendering runs. Include a reconciliation report that links visuals to source ledgers or custodial records.
Which chart types work best for investment reporting dashboards?
Time-series line charts for performance, waterfall charts for bridges like net flows and returns, stacked area for allocation, and scatter plots for risk-return analyses. Interactive drilldowns help analysts validate and explore drivers behind aggregates.
How to validate AI-generated narratives and alerts?
Use a dual-path approach: deterministic checks for core financial metrics and human-in-the-loop review for model-driven narratives until confidence thresholds are proven in production. Track false positives/negatives to refine thresholds.
What are the first steps to implement automated financial charting?
Identify a single report to automate, map required data sources, apply the VISUAL checklist (validate, integrate, select visuals, automate, and log), and run parallel production vs. automated outputs until parity is confirmed.