Team Statistics Analyzer: Step-by-Step Fantasy Sports Strategy Optimization
-

- March 24th, 2026
- 168 views


FREE SEO Topical Map Generator: Find Your Next Content Ideas
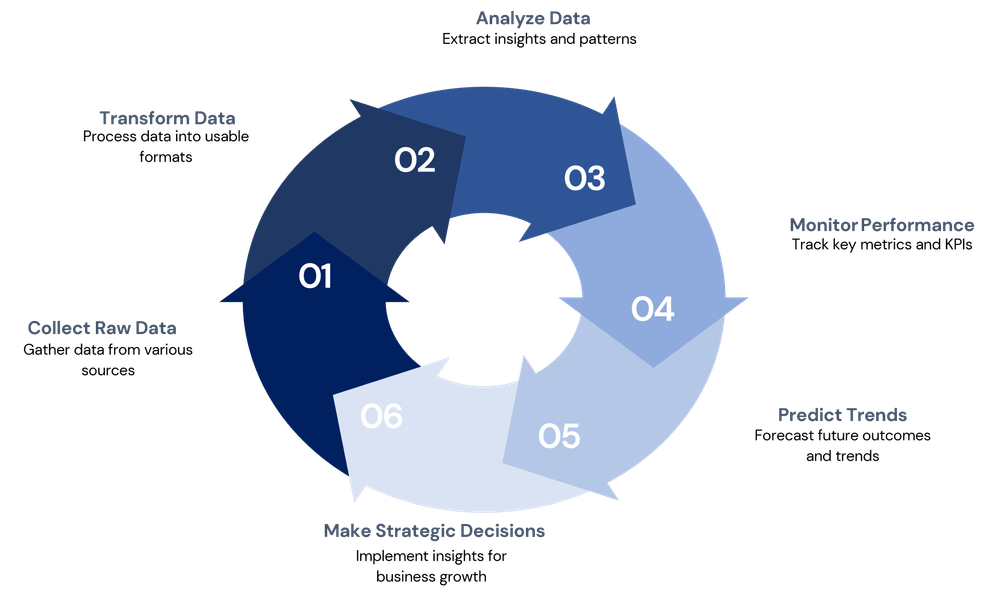
A team statistics analyzer turns raw game and player data into actionable decisions for fantasy managers. The team statistics analyzer extracts team-level trends, opponent context, and player opportunity metrics to inform lineup choices, waiver adds, and trade targets.
- Define inputs: league settings, roster rules, official box scores.
- Track opportunity metrics (targets, carries, snaps) and team stat trends (pace, offensive line, usage).
- Use the RANGE checklist to convert stats into strategy: Relevant, Adjusted, Normalized, Granular, Evaluated.
- Backtest with recent seasons and validate projections before changing lineups.
How a team statistics analyzer improves fantasy sports strategy
Use a team statistics analyzer to convert team performance and matchup context into higher-confidence fantasy decisions. A focused analyzer reduces noise by emphasizing opportunity, matchup-adjusted projections, and stability signals—elements that drive outcomes more reliably than raw box-score totals alone.
Required inputs and foundational metrics
Essential data inputs
Start with these sources: league scoring rules, recent box scores, snap counts, target shares, red-zone opportunities, opponent defensive splits, and injury reports. Official league stat pages provide the baseline box-score data used for modeling; for example, official NFL statistics aggregate play-by-play and advanced metrics for each game: https://www.nfl.com/stats.
Core metrics to track
- Opportunity metrics: targets per route run, carries, snaps, air yards.
- Efficiency metrics: yards per route run, yards per carry, catch rate.
- Context metrics: pace of play, opponent defensive ranking vs position, home/away splits.
- Team stat trends: % pass vs run, red-zone shares, defensive turnover rate.
Step-by-step workflow to build and run a team statistics analyzer
Step 1 — Normalize and clean data
Convert box scores and play-by-play data to per-snap or per-opportunity rates. Normalize across teams and seasons (e.g., per 100 plays) to make comparisons consistent. Flag outliers like truncated games or garbage-time volumes.
Step 2 — Compute matchup-adjusted projections
Adjust raw rates with opponent strength and game script probabilities. Use rolling windows (e.g., last 4–8 weeks) to weight recent role changes, then blend historical and recent weights to avoid overreacting to single-game spikes.
Step 3 — Rank and recommend actions
Create composite scores that combine projected fantasy points, variance, and floor. Use these scores to sort starting candidates, identify high-upside waiver targets, and evaluate trade returns.
Named framework: the RANGE checklist
Apply the RANGE checklist before making roster moves:
- Relevant: Track metrics tied directly to fantasy scoring (targets, carries, red-zone usage).
- Adjusted: Adjust for opponent strength and pace of play.
- Normalized: Convert to per-play or per-opportunity rates for fair comparison.
- Granular: Break data down by down, distance, and game state when useful.
- Evaluated: Backtest recommendations on recent weeks and record realized vs projected outcomes.
Practical implementation tips
- Automate data pulls and compute rolling averages to capture role changes quickly.
- Weight target- and snap-share more than efficiency early in the season; usage drives volume-related scoring.
- Include a volatility metric (standard deviation of weekly points) when choosing between high-floor and high-upside players.
- Re-run matchup adjustments after major injuries—snap redistribution is common and immediate.
Real-world example scenario
Scenario: A 10-team PPR league. Target data shows a receiver with target share rising from 12% to 23 over the last three games while the team's pass attempt rate has increased 10% and the primary competitor is injured. The team statistics analyzer normalizes target share per route run, adjusts for opponent coverage rank, and projects a 30% increase in expected weekly points. Recommendation: start the receiver in lineups facing a below-average pass defense and prioritize adding in single-digit waivers because high usage drives sustainable fantasy value.
Trade-offs and common mistakes
Trade-offs
Complex models capture more nuance but require more trustworthy data and maintenance. Simple rules (e.g., start the highest target share) are easier to apply but may miss matchup or injury-driven upside. Choose the complexity level that matches available data, time, and required reliability.
Common mistakes
- Overfitting to single-game outliers (one big game should not rewire projections).
- Confusing efficiency spikes with durable role increases—volume matters more for floor.
- Failure to consider game script—high-projected points in a blowout loss scenario are unlikely.
Validation and backtesting
Backtest the analyzer on the past 2–3 seasons where possible, measuring accuracy of projected points and roster decisions. Track calibration (how often projections land within expected ranges) and decision lift (how lineup changes affected outcomes versus control baselines).
Practical tips summary
- Prioritize opportunity metrics (snaps, targets) early in the season.
- Use rolling windows and blend historical with recent data to detect real role changes.
- Automate injury and depth-chart monitoring for timely adjustments.
- Record results and iterate: maintain a simple log of projection errors and decision outcomes.
FAQ
How to use a team statistics analyzer for lineup decisions?
Use projections from the team statistics analyzer to compare expected value and variance between starters and bench options. Prioritize players with high projected points and acceptable variance for must-win weeks; use upside picks in tournaments. Always cross-check for injuries and late news.
Which metrics matter most for fantasy sports strategy optimization?
Opportunity metrics (targets, carries, snaps), red-zone shares, and opponent matchup adjustments typically matter most. Efficiency helps refine projections but is less reliable than sustained usage patterns.
How often should projections be updated?
Update projections daily during the week and after major news (injuries, depth chart changes). Automate weekly recalculations and perform a final check the morning of game day.
Can a team statistics analyzer replace scouting and league knowledge?
No. The analyzer complements scouting and situational awareness. Combine model output with league rules, roster constraints, and late-breaking reports for the best decisions.
What common validation methods should be used for a team statistics analyzer?
Use rolling backtests, calibration checks, and A/B comparisons of recommended lineups against a baseline strategy. Track key performance indicators like hit rate for top-start recommendations and average fantasy points gained per decision.