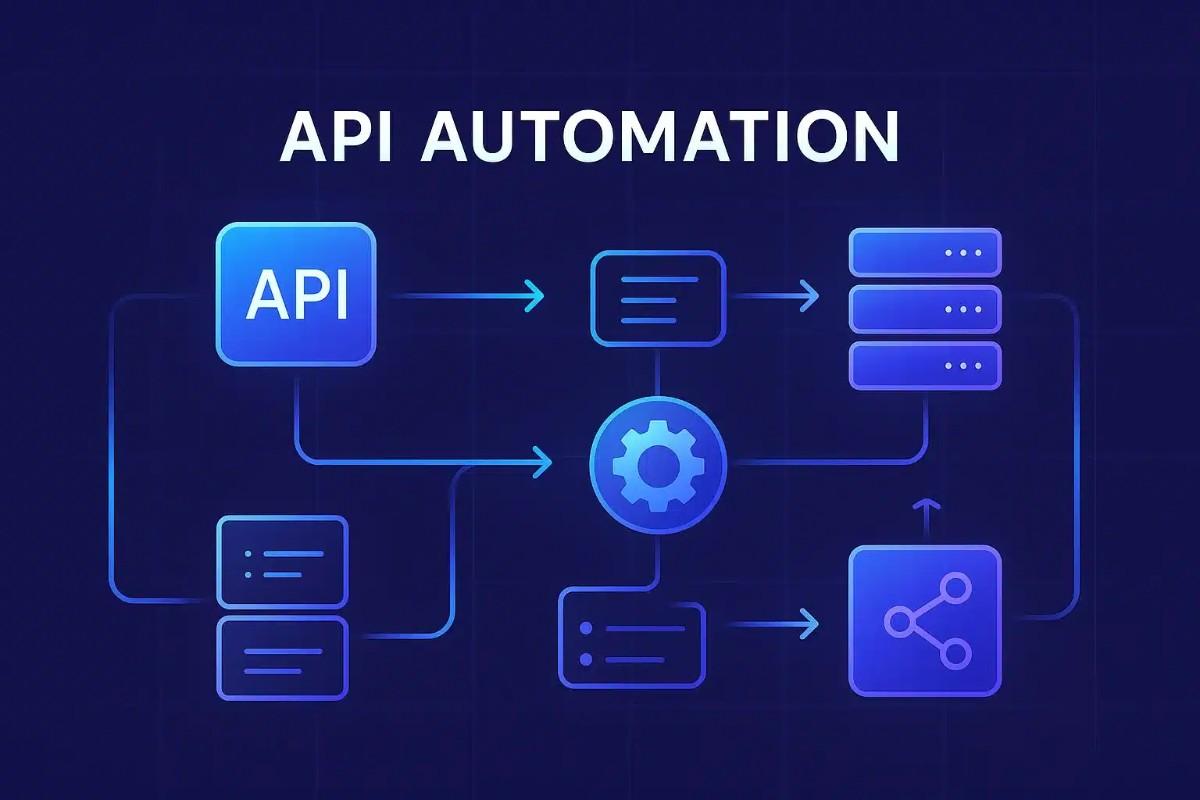
Production Monitoring and Logging for Django: Metrics, Traces, Logs, and Alerts
-

- March 01st, 2026
- 1,379 views

FREE SEO Topical Map Generator: Find Your Next Content Ideas
Effective monitoring and logging for Django applications in production is essential for reliability, incident response, and performance tuning. This guide explains the core concepts (logs, metrics, traces), practical configuration steps, deployment considerations, and recommended maintenance practices for production Django services.
- Collect structured logs from Django and WSGI servers and centralize them for search and retention.
- Instrument metrics (request rates, latency, error counts) and export to a metrics backend for dashboards and alerts.
- Use distributed tracing to connect performance problems across services.
- Configure health checks, alerting rules, secure transport, and log retention policies for production readiness.
monitoring and logging for Django applications in production
Key observability concepts
Observability for web applications combines three signal types: logs (text or structured events), metrics (numerical time series), and traces (request-level latency and causality). Using these together helps diagnose HTTP 5xx errors, slow database queries, or background-job failures. The Django Software Foundation and Python Software Foundation produce official guidance and libraries; for framework configuration refer to the Django docs.
Logging basics for Django
Django uses Python's standard logging module. In production, configure structured logging (JSON) where possible, include request identifiers, user IDs (when privacy permits), and useful context like view names and database query counts. Typical practices include:
- Define handlers for console, file, and external log shippers in LOGGING in settings.py.
- Set appropriate log levels (INFO for general access logs, WARNING/ERROR for unexpected conditions).
- Attach a request ID via middleware so logs across services can be correlated.
- Avoid logging sensitive personal data; follow applicable privacy rules and retention policies.
For configuration examples and specifics about Django's logging settings, see the Django documentation.
Collecting and centralizing logs
Ship logs from application hosts to a central store for search and retention. Options include syslog-forwarders, Fluentd/Fluent Bit, or agents that send to a log storage system. Ensure logs are timestamped with timezone-aware timestamps, and implement rotation to avoid disk exhaustion. Retention and access controls help meet compliance needs.
Metrics: what to collect and how
Collect metrics for uptime, traffic, latency percentiles, error rates (4xx and 5xx), database query time, cache hit ratios, and background-job performance. Export metrics using a client library that exposes an endpoint or pushes to a collector. Tag metrics with service, environment, and instance identifiers to aid slicing in dashboards. Use percentiles (p50, p95, p99) for latency instead of averages.
Tracing and distributed context
Distributed tracing connects spans across services and external dependencies. Instrument Django views, database calls, and HTTP client requests to capture end-to-end traces for slow transactions. Open telemetry concepts (metrics + traces + logs) are widely adopted for this purpose; ensure HTTP headers propagate trace IDs so downstream services link spans.
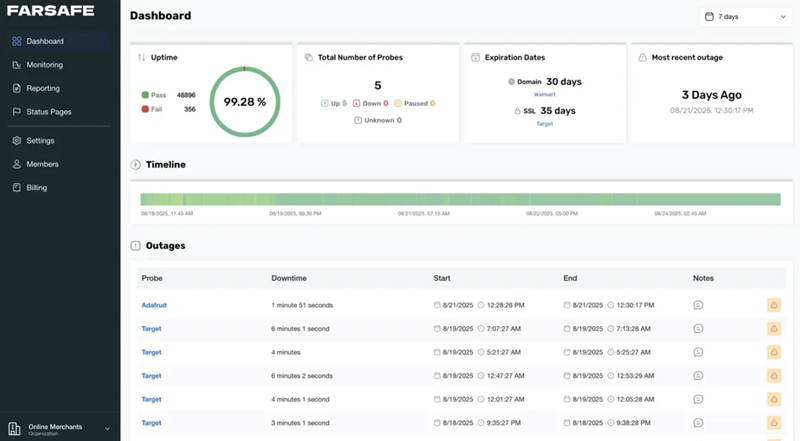
Alerting, dashboards, and runbooks
Create actionable alerts tied to service-level indicators (SLIs) such as error budget burn rate, increased p99 latency, or queue backlog growth. Avoid alert fatigue by tuning thresholds and using multi-condition rules (e.g., elevated error rate sustained for N minutes). Pair alerts with runbook playbooks that list remediation steps, rollback instructions, and escalation paths.
Deployment and operational considerations
Health checks and readiness
Expose liveness and readiness endpoints so load balancers and orchestrators (e.g., Kubernetes) can determine if an instance should receive traffic. Readiness may depend on external resources like databases or caches; liveness should be inexpensive and avoid masking transient dependency issues.
Security, privacy, and compliance
Secure observability pipelines: use TLS for transport, authenticate agents/clients, and restrict access to logs and metrics UIs. Redact or avoid logging sensitive fields (passwords, tokens, PII). Maintain retention policies and audit logging to meet regulatory requirements.
Scaling and cost control
Sampling traces at a configurable rate reduces storage and processing costs. Aggregate high-cardinality metrics or use histograms carefully. Rotate logs and implement lifecycle policies in the central store; compress older archives where appropriate.
Maintenance and testing
Test alerting rules and runbooks with game-day exercises. Validate logging and metrics on deploy pipelines by running smoke tests that assert key metrics and log events appear. Regularly review queries and dashboards for drift as the application evolves.
Operational tools and ecosystem notes
Common signal collectors and backends
Typical observability architectures use exporters/collectors to forward logs, metrics, and traces to dedicated backends for analysis and visualization. Consider vendor-neutral telemetry formats and protocols to reduce lock-in. The Cloud Native Computing Foundation maintains projects and guidance for metrics and tracing standards used in many production stacks.
Integrations with Django
Instrument common layers: Django middleware for request timing and request IDs, database wrappers to capture query timings, and background workers (Celery, RQ) for job metrics and logs. Ensure WSGI/ASGI servers also emit host-level metrics and logs.
Documentation and training
Document the logging format, metric names, and tracing conventions in a central team handbook. Ensure on-call rotations have access to dashboards and clear escalation steps. Regularly update documentation as instrumentation evolves.
References and governance
Follow guidance from the Django Software Foundation and standard Python logging documentation for framework-level configuration. For metrics and tracing standards, consult community projects and specifications maintained by open-source observability initiatives.
FAQs
How to implement monitoring and logging for Django applications in production?
Start with structured logging and request ID middleware, export key metrics (request rate, latency, errors), add lightweight tracing, and centralize signals to a searchable backend. Configure alerts tied to SLIs and maintain runbooks for incident response. Ensure secure transport and data retention policies are in place.
What logs should be collected from a Django production app?
Collect application logs (INFO, WARNING, ERROR), access logs from the HTTP server, WSGI/ASGI server logs, and logs from background workers and database hosts. Include contextual fields (timestamp, request_id, path, status_code) and avoid sensitive data.
How to keep observability costs under control?
Apply sampling for traces, reduce high-cardinality labels on metrics, aggregate or roll up metrics, compress and archive old logs, and tune retention policies to balance compliance and cost.
Who maintains the official Django logging guidance?
The Django Software Foundation and Django project documentation provide official guidance for configuring logging and settings for production deployments.