Grafana Open Source: Practical Best Practices for Fast, Maintainable Dashboards
-

- February 23rd, 2026
- 1,352 views

FREE SEO Topical Map Generator: Find Your Next Content Ideas
Grafana Open Source is a popular platform for visualizing time-series and application metrics. This guide summarizes best practices for building efficient, maintainable dashboards that perform well at scale, work with common data sources like Prometheus or SQL databases, and support reliable alerting and governance.
- Model data and queries to reduce cardinality and aggregation cost.
- Design dashboards for clarity: limit panels, use consistent time ranges, and apply templates.
- Optimize performance with caching, downsampling, and datasource-side aggregations.
- Provision dashboards and use version control for reproducibility and auditability.
- Harden access with RBAC, single sign-on, and network controls; monitor dashboard health and costs.
Grafana Open Source: core principles for dashboard efficiency
Plan data sources and modeling
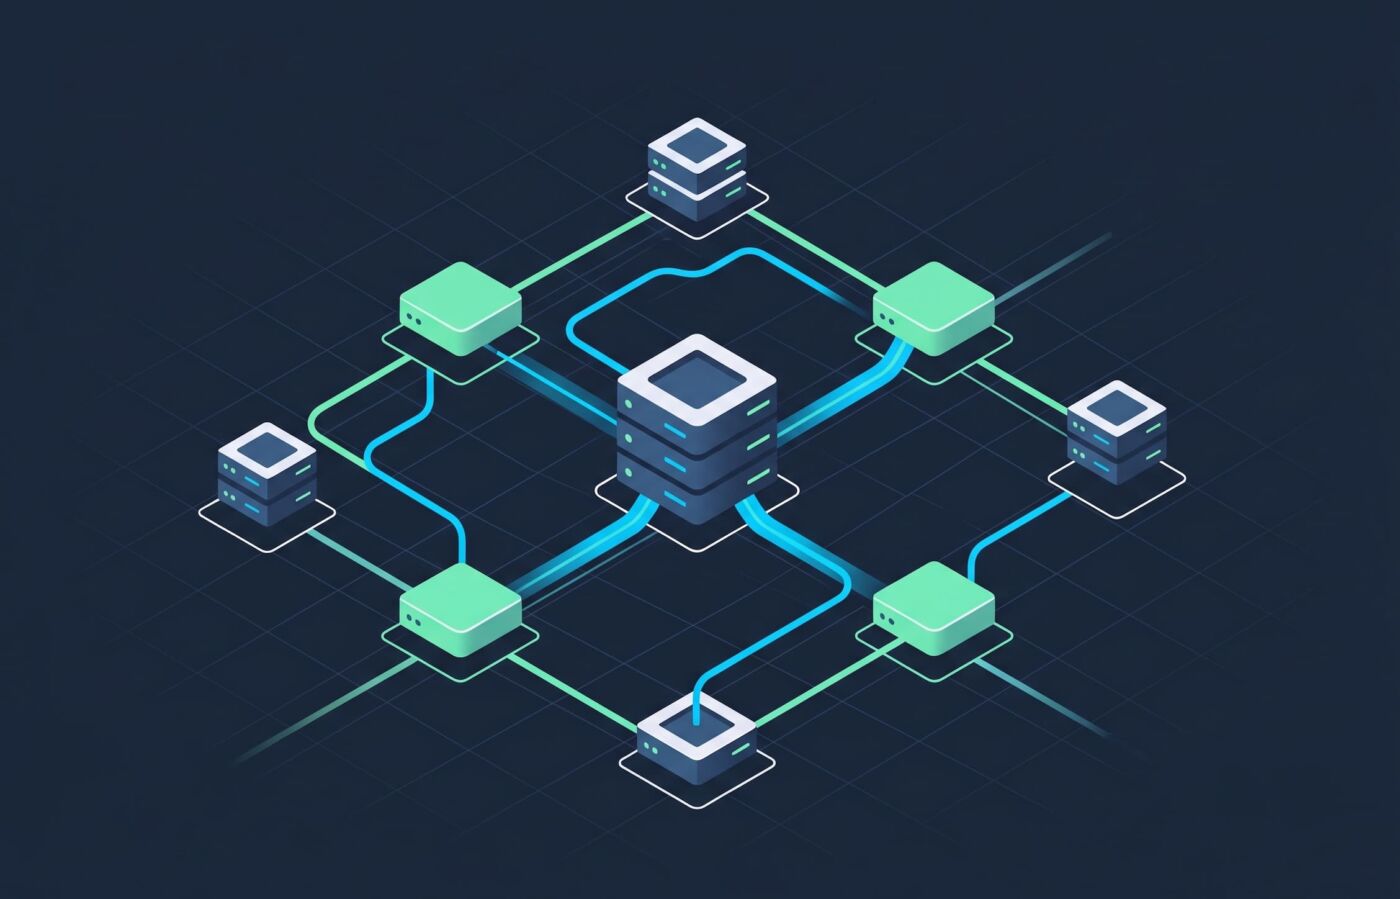
Choose the appropriate data store and model metrics to minimize query cost. Time-series systems such as Prometheus, InfluxDB, or OpenTelemetry backends are optimized for high-cardinality metrics when labels and metrics are designed carefully. Avoid unbounded label cardinality (for example, using raw user IDs as a label) and prefer aggregated or hashed identifiers where possible. Implement retention and downsampling strategies in the storage layer to keep query windows efficient.
Write efficient queries
Place computation as close to the data as possible. Use datasource-native aggregations and group-by operations instead of fetching raw high-resolution time series and aggregating in Grafana. Limit the number of series returned per query and avoid expensive joins or unbounded subqueries. When using Prometheus, prefer rate() and increase() functions with appropriate range vectors to reduce cardinality spikes.
Design clear, focused dashboards
Each dashboard should answer a specific operational or business question. Limit the number of panels per dashboard and avoid overloading a single view. Use templating variables for reusable dashboards so a single dashboard can inspect different hosts, services, or environments without creating clones. Apply consistent color scales and panel thresholds to help users interpret data quickly.
Performance and scaling strategies
Reduce cardinality and apply downsampling
High-cardinality timeseries are a common cause of slow dashboards. Implement aggregation at ingestion or in the data store and retain high-resolution data for shorter periods. Use downsampling to create rollup tables for long-range queries; this reduces I/O for long time ranges while preserving trend visibility.
Leverage caching and query limits
Enable caching at the datasource or proxy layer where supported. Configure query timeout and maximum data points to avoid runaway queries. Set sensible auto-refresh intervals and allow users to disable auto-refresh for complex views. For multi-tenant deployments, enforce per-tenant resource limits to prevent a single user from degrading performance.
Scale Grafana components
In larger environments, separate read and write workloads and scale Grafana instances horizontally behind a load balancer. Use a centralized configuration and provisioning approach (see provisioning section) so new instances share the same dashboard set and data source definitions. Monitor Grafana server metrics (API latency, memory usage, plugin performance) to detect hotspots.
Security, access control, and governance
Authentication and role-based access
Integrate Grafana with an identity provider for single sign-on (SSO) and centralized user management. Use role-based access control (RBAC) to restrict editing and administrative privileges. For regulated environments, record configuration changes and restrict snapshot/export capabilities to avoid accidental data leaks.
Network and data protection
Restrict access to data sources using network policies and credentials management. Use secure connections (TLS) between Grafana and back-end systems. When dashboards display sensitive information, apply column masking or aggregated views instead of raw detail. Follow organizational security standards and guidance from bodies such as the Cloud Native Computing Foundation (CNCF) when integrating CNCF projects like Prometheus or OpenTelemetry.
Provisioning, version control, and observability of dashboards
Use provisioning for repeatability
Store dashboard JSON and data source definitions in version control. Use Grafana provisioning to load dashboards and datasources automatically during deployment. This practice reduces configuration drift, simplifies disaster recovery, and enables peer review of dashboard changes.
Track dashboard usage and test changes
Monitor which dashboards and panels receive regular traffic; retire unused dashboards to reduce cognitive load and resource consumption. Implement a change-management workflow for dashboard edits, with staging environments for validating performance impacts and visual correctness before rolling out to production.
Alerts, thresholds, and long-term monitoring
Create reliable alerts
Configure alerts with stable, tested query expressions and sensible evaluation windows to reduce flapping. Route alerts to appropriate channels and ensure alerting rules are monitored as part of platform health. Keep alerting logic near the data store when possible (for example, using the data source's native alert features) to reduce load on the visualization tier.
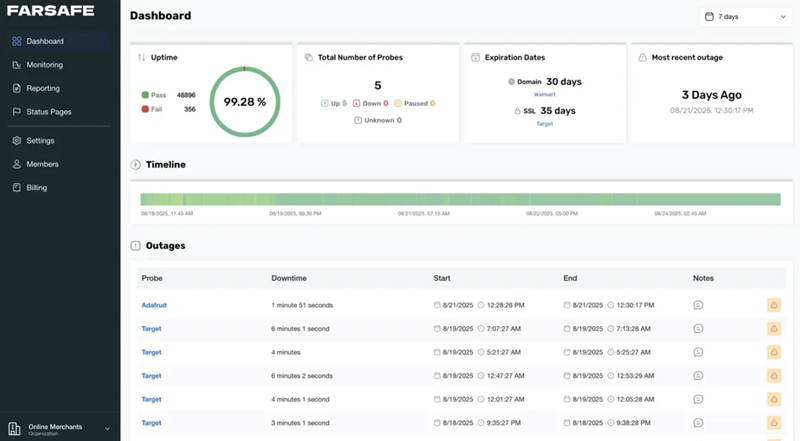
Monitor costs and telemetry
Track query volume, dashboard rendering times, and downstream data transfer to understand operational cost. Use platform telemetry to identify expensive dashboards and optimize them iteratively. Consider instrumenting Grafana itself and collecting metrics in a dedicated observability pipeline.
For detailed implementation details, refer to the official documentation: Grafana documentation.
Maintenance checklist
- Audit dashboard catalog quarterly and remove duplicates.
- Enforce naming conventions and tag dashboards by owner and purpose.
- Back up provisioning files and store them in version control.
- Apply security updates to Grafana and datasource components promptly.
- Review alert noise levels and refine thresholds regularly.
FAQ: What is Grafana Open Source and why use it?
Grafana Open Source is a visualization and analytics platform used to build dashboards that display metrics, logs, and traces from various data sources. It enables teams to explore telemetry data, create alerts, and share insights across stakeholders. The open-source edition supports many common back ends and a wide plugin ecosystem.
How can dashboards be provisioned and version-controlled?
Dashboards and data sources can be exported as JSON files and stored in version control. Grafana supports provisioning folders, dashboards, and datasources from configuration files during startup so infrastructure-as-code workflows can manage dashboard lifecycle and deployment.
Which performance optimizations help with slow panels?
Optimize queries to reduce returned series, use datasource-side aggregations, implement downsampling for long-range queries, enable caching, and limit dashboard refresh rates. Reviewing the underlying data model and retention policies often yields the largest gains.
How should access be controlled for dashboards in multi-team environments?
Use centralized identity providers and RBAC to grant permissions by team and role. Restrict admin and editor rights to a small group, and use folder-level permissions to isolate production and staging dashboards.
Can Grafana Open Source scale for large environments?
Yes. Scaling strategies include horizontal Grafana instances behind a load balancer, centralized provisioning, datasource scaling, and enforcing query limits. Observability of Grafana's own metrics assists in capacity planning and performance tuning.